
Pivot Points: Calculating and Using Them in Day Trading
Time to read: 16 minutes
Learn to use pivot points in day trading with this guide covering calculations, key strategies, and essential tools to trade forex and other markets more effectively.
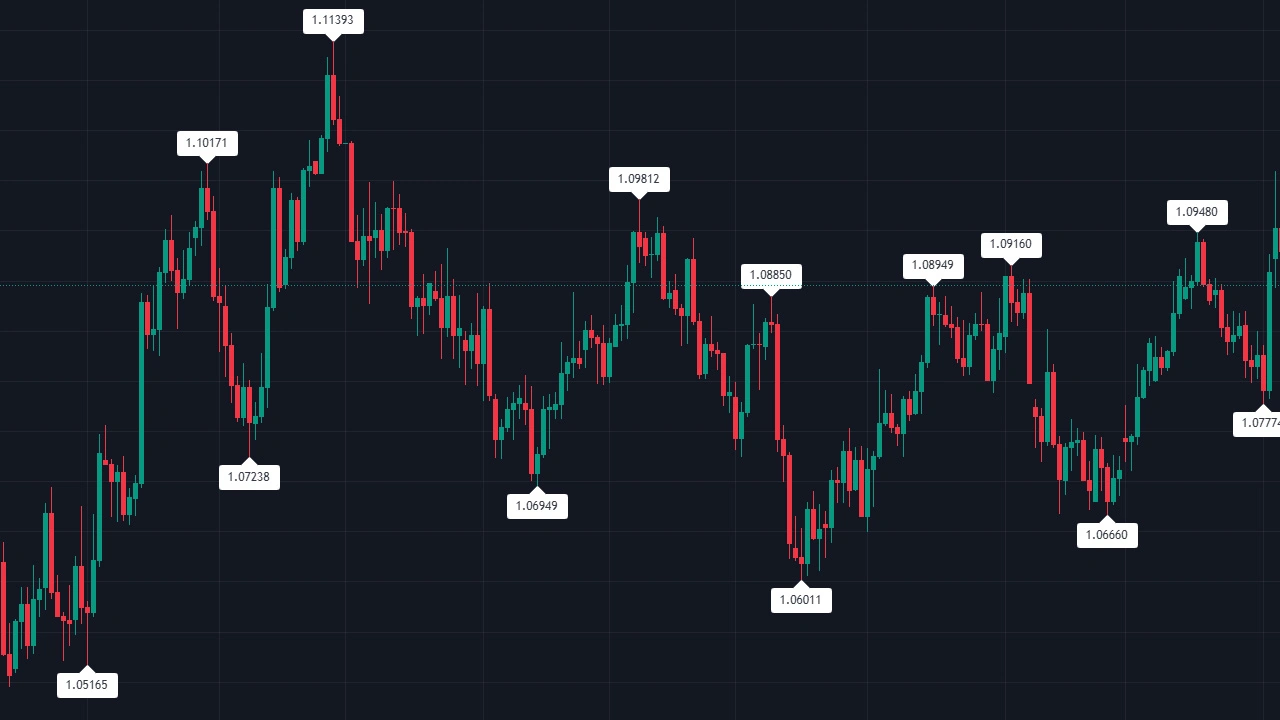
Pivot points in Forex trading are predefined price levels calculated from previous market data and used as reference areas for support, resistance, intraday bias, breakouts, and range trading. Unlike manually drawn support and resistance, traditional pivot levels are generated from a fixed mathematical formula.
Pivot points do not predict where a currency pair must reverse or where a breakout will succeed. A pivot level is a technical reference rather than a guaranteed barrier. Traders still need to evaluate market structure, volatility, economic events, execution costs, and risk before entering a position.
This guide explains how Forex pivot points are calculated, how Standard, Fibonacci, Woodie, Camarilla, and DeMark methods differ, and how traders can use pivot levels for intraday support, resistance, breakout, and range strategies.
Introduction to Pivot Points
What Are Pivot Points?
Pivot points are mathematically calculated price levels derived from a previous completed trading period.
For daily Standard Pivot Points, the main Pivot Point uses the previous session's:
- High.
- Low.
- Close.
The calculation produces a central Pivot Point, normally labeled PP or P, together with support and resistance levels such as S1, S2, S3, R1, R2, and R3.
What Pivot Points Represent
Pivot levels provide objective reference prices that traders can compare with current market behavior.
They can be used to evaluate:
- Intraday directional bias.
- Potential support.
- Potential resistance.
- Breakout areas.
- Range boundaries.
- Possible entry, stop, and target locations.
Price Above or Below the Pivot Point
A common pivot-point convention treats price above the central pivot as a bullish intraday bias and price below it as a bearish bias.
This should not be interpreted as proof of market sentiment or future direction.
EUR/USD can trade above the Pivot Point and subsequently decline through it. The level provides a reference for the trading framework rather than a complete trend signal.
Forex Session Boundaries Matter
Forex trades continuously during the business week, so there is no single global exchange close for spot FX.
Daily pivot calculations can therefore differ when data providers use different session cutoffs.
A common convention in retail Forex is to use the New York 5:00 p.m. close when defining the completed trading day. Traders should check how their charting platform defines its daily session because different cutoffs can produce different highs, lows, closes, and pivot levels.
Understanding Pivot Points Calculation
Key Components of Pivot Points
The traditional pivot calculation starts with the previous completed period's high, low, and close.
These values produce:
- PP: Central Pivot Point.
- R1: First resistance level.
- R2: Second resistance level.
- R3: Third resistance level.
- S1: First support level.
- S2: Second support level.
- S3: Third support level.
The Formula for Calculating Pivot Points
The traditional Pivot Point is:
PP = (High + Low + Close) / 3
First Support and Resistance
R1 = (2 × PP) - Low
S1 = (2 × PP) - High
Second Support and Resistance
R2 = PP + (High - Low)
S2 = PP - (High - Low)
Third Support and Resistance
R3 = High + 2 × (PP - Low)
S3 = Low - 2 × (High - PP)
Pivot Points Are Calculated, Not Predicted
Once the previous period is complete, the traditional pivot levels are determined mathematically.
What remains uncertain is how price will behave around them.
A calculated R1 level does not mean price is required to stop at R1. The market can reverse before reaching it, consolidate around it, or move directly through it.
Different Types of Pivot Points
Several pivot-point systems use different formulas. Traders should identify which calculation their platform uses before comparing levels across charts.
Standard Pivot Points
Standard or Traditional Pivot Points use the previous high, low, and close to calculate the central pivot and surrounding support and resistance levels.
They are commonly used for intraday analysis but can also be calculated from weekly or monthly data.
Fibonacci Pivot Points
Fibonacci pivots begin with the same basic central Pivot Point:
PP = (High + Low + Close) / 3
The previous period's range is then multiplied by commonly used Fibonacci-derived values:
- R1 = PP + 0.382 × Range.
- R2 = PP + 0.618 × Range.
- R3 = PP + 1.000 × Range.
- S1 = PP - 0.382 × Range.
- S2 = PP - 0.618 × Range.
- S3 = PP - 1.000 × Range.
These ratios create alternative reference levels. They do not establish that price has a higher probability of reversing simply because a Fibonacci calculation was used.
Camarilla Pivot Points
Camarilla pivots use the previous high-low range and close to create a tighter series of levels around the previous closing price.
A commonly implemented set includes R1 through R4 and S1 through S4:
- R1 = Close + 1.1 × Range / 12.
- R2 = Close + 1.1 × Range / 6.
- R3 = Close + 1.1 × Range / 4.
- R4 = Close + 1.1 × Range / 2.
- S1 = Close - 1.1 × Range / 12.
- S2 = Close - 1.1 × Range / 6.
- S3 = Close - 1.1 × Range / 4.
- S4 = Close - 1.1 × Range / 2.
Camarilla levels are frequently used in short-term range and breakout frameworks, while the levels themselves do not dictate which strategy should be used.
Woodie’s Pivot Points
Woodie pivot formulas require extra care because platform implementations are not completely standardized.
One widely used version gives additional weight to the previous closing price:
PP = (High + Low + 2 × Close) / 4
TradingView's current Woodie implementation instead uses the current period's opening price:
PP = (Previous High + Previous Low + 2 × Current Open) / 4
Traders should therefore verify the exact Woodie formula used by their platform rather than assuming all Woodie pivot indicators will produce identical levels.
Demark Pivot Points
DeMark, often labeled DM on charting platforms, uses a conditional calculation based on the relationship between the previous open and close.
A common implementation uses:
- If Close < Open: X = High + (2 × Low) + Close.
- If Close > Open: X = (2 × High) + Low + Close.
- If Close = Open: X = High + Low + (2 × Close).
The levels are then calculated from X:
R1 = (X / 2) - Low
S1 = (X / 2) - High
This method differs materially from the traditional multi-level pivot framework.
No Pivot Method Is Universally Best
Different formulas produce different levels from the same market data.
A trader should select the method according to a defined strategy and test its historical behavior rather than switching between calculations to find the level that best explains a completed price move.
How to Use Pivot Points in Day Trading
Start With Market Structure
Pivot points are more useful when interpreted within the current market condition.
Before trading a pivot level, identify whether price is:
- Trending.
- Ranging.
- Breaking out.
- Consolidating.
Using Pivot Points as Support and Resistance Levels
S1, S2, and S3 can be monitored as potential support references, while R1, R2, and R3 can be monitored as potential resistance references.
The word potential matters.
A trader should observe how price behaves at the level rather than assuming support means buy and resistance means sell.
Pivot Rejection
A rejection strategy requires evidence that price reached a pivot area and failed to continue through it.
Possible evidence can include:
- A failed breakout.
- A strong close away from the level.
- A new short-term swing structure.
- Repeated inability to maintain price beyond the pivot.
Setting Entry and Exit Points
Pivot levels can help organize an entry, invalidation, and target.
For example, a trader evaluating a long position around S1 can:
- Wait for evidence that S1 is being defended.
- Define the entry trigger.
- Place invalidation beyond the structure that would disprove the setup.
- Evaluate PP or another relevant level as a possible target.
- Calculate position size from the stop distance and intended monetary risk.
The stop should not be placed immediately below S1 simply because S1 has a support label.
Trading Strategies with Pivot Points
Breakout Strategy
A pivot breakout strategy looks for price moving through a calculated level and maintaining acceptance beyond it.
A trader can require:
- A completed close beyond the pivot level.
- A break of nearby market structure.
- Follow-through.
- A successful retest.
Reversal Strategy
A reversal strategy evaluates whether price rejects a pivot level instead of continuing through it.
The pivot identifies the location. Subsequent price behavior provides the trading evidence.
Range Trading Strategy
In a range, support and resistance pivots can help define areas where price might rotate.
Traders should stop treating the range as intact when price begins establishing closes and new structure beyond its boundaries.
Pivot Retest Strategy
A level that has been broken can later be retested from the opposite side.
For example, R1 can become a support reference after an upside breakout.
This role reversal should be confirmed from actual price behavior rather than assumed in advance.
Volume Confirmation in Spot Forex
Breakout strategies are sometimes described as requiring high volume.
This needs qualification in spot Forex because there is no single centralized exchange reporting complete global spot-FX transaction volume.
A retail platform can provide tick volume, broker-specific volume, or venue-specific activity. These can be useful analytical inputs while they should not be described as total Forex market volume.
Advantages and Limitations of Using Pivot Points
Benefits of Pivot Points
Objective Calculations
Once the calculation method and previous-period data are fixed, the pivot levels are generated automatically.
This reduces the discretion involved in manually selecting support and resistance.
Clear Intraday Reference Levels
Pivot points provide predefined prices that can be monitored before a trading session begins.
Multiple Strategy Applications
The same levels can be incorporated into:
- Trend trading.
- Breakout trading.
- Range trading.
- Reversal strategies.
Suitable for Different Markets
Pivot formulas can be applied to markets with usable high, low, close, and where required, open data.
Their usefulness still depends on the instrument, trading session, market structure, liquidity, and strategy.
Limitations and Drawbacks
Pivot Levels Are Not Guaranteed Support or Resistance
The fact that R1 is mathematically labeled resistance does not mean sellers must appear there.
Price can trade through several pivot levels during a strong directional move.
Session Definitions Can Change the Levels
Different daily closing conventions can produce different Forex pivot calculations.
Several Calculation Methods Exist
Standard, Fibonacci, Woodie, Camarilla, and DM methods can produce materially different levels.
This makes it important to specify exactly which calculation is being tested.
Volatility Changes Their Practical Meaning
Pivot calculations use historical period data.
An unusually large new economic shock can create price movement far beyond levels generated from the previous session.
Confirmation Does Not Eliminate Failed Trades
Candlestick patterns, RSI, MACD, moving averages, or other indicators can add context while none guarantees that a pivot setup will work.
Market Sentiment Should Be Framed as Bias
Calling the Pivot Point a definitive market sentiment indicator overstates what the calculation shows.
Price above PP can be treated as a bullish technical bias within a specific pivot strategy, while price below PP can create a bearish bias.
The actual Forex market contains many participants with different positions and objectives, so one calculated price cannot measure complete market sentiment.
Examples of Pivot Points in Action
Step-by-Step Calculation Example
Assume the previous EUR/USD session recorded:
- High: 1.2050.
- Low: 1.1950.
- Close: 1.2000.
Calculate the Pivot Point
PP = (1.2050 + 1.1950 + 1.2000) / 3
PP = 1.2000
Calculate R1 and S1
R1 = (2 × 1.2000) - 1.1950 = 1.2050
S1 = (2 × 1.2000) - 1.2050 = 1.1950
Calculate R2 and S2
The previous range is:
1.2050 - 1.1950 = 0.0100
R2 = 1.2000 + 0.0100 = 1.2100
S2 = 1.2000 - 0.0100 = 1.1900
Calculate R3 and S3
R3 = 1.2050 + 2 × (1.2000 - 1.1950) = 1.2150
S3 = 1.1950 - 2 × (1.2050 - 1.2000) = 1.1850
Real-Life Day Trading Scenarios
Example 1: Rejection From S1
EUR/USD trades below PP and approaches S1.
Price briefly moves through S1 but closes back above it. A later candle forms a higher low and breaks a short-term swing high.
The trader treats the price action as evidence of rejection and considers PP as a possible upside reference.
The setup can still fail if EUR/USD subsequently returns below the defined invalidation level.
Example 2: R1 Breakout
GBP/USD trades above PP and reaches R1.
Instead of reversing, price closes decisively above R1 and remains above it on the following pullback.
The trader can treat former R1 as a possible support reference while evaluating R2 as the next calculated pivot level.
R2 is a target reference rather than a price the market is required to reach.
Example 3: Pivot Level Fails During News
USD/JPY approaches R2 shortly before a major central bank announcement.
The release produces a large directional move that passes through R2 and R3 without a meaningful reversal.
The example demonstrates why mathematically calculated levels do not override major changes in economic information and market expectations.
Combining Pivot Points with Other Indicators
Using Moving Averages
Moving averages can provide trend context around pivot levels.
Price being above both PP and a moving average can support a bullish technical framework, although it does not independently prove that the market is in a sustainable uptrend.
The actual sequence of swing highs and lows should also be considered.
Combining with RSI and MACD
RSI
RSI measures recent momentum between 0 and 100.
Readings above 70 and below 30 are traditionally described as overbought and oversold. They are not automatic reversal signals.
RSI can remain elevated or depressed during strong trends.
MACD
MACD measures relationships between exponential moving averages and can provide information about momentum and trend behavior.
A MACD crossover near a pivot level does not independently validate the pivot or guarantee a reversal.
Combining Pivot Points With Price Action
Price action can provide direct evidence about how the market responds to a calculated pivot.
Useful observations include:
- Rejection.
- Breakout closes.
- Retests.
- Higher lows.
- Lower highs.
- Failed breakouts.
Avoid Duplicate Confirmation
Adding several indicators does not automatically increase the probability of success.
Moving averages, MACD, RSI, and price-based indicators can contain overlapping information. Each tool should have a defined role rather than being added simply to create more apparent confirmation.
Tips for Effective Day Trading with Pivot Points
Use the Correct Session Data
Confirm which daily close your trading platform uses before comparing pivot levels with another source.
Mark Pivot Levels Before the Session
Because pivot levels are calculated from completed prior data, they can be identified before the current trading period develops.
This makes it possible to define scenarios in advance rather than deciding how to interpret the level only after price reacts.
Treat Levels as Areas of Interest
Although a pivot calculation produces one exact price, real market reactions do not always occur at one precise decimal point.
Spread, volatility, and execution can cause price to trade slightly through a level before a meaningful response develops.
Use Multiple Timeframes Carefully
Higher timeframes can provide broader market structure while lower timeframes can provide entry detail.
Multiple-timeframe analysis supplies additional context without automatically improving accuracy.
Combine with Fundamental Analysis
Economic events can change the meaning of nearby technical levels quickly.
Important events include:
- Central bank decisions.
- Inflation releases.
- Employment reports.
- GDP releases.
- Major unexpected geopolitical developments.
Practice Risk Management
Define invalidation before calculating position size.
Standard stop-loss orders remain subject to slippage, so the stop price should not be treated as an absolute maximum loss.
Avoid Overleveraging
Broker maximum leverage is a limit rather than a position-sizing target.
The amount of exposure should come from the trade's stop distance and planned monetary risk.
Backtest the Exact Pivot Method
Historical testing should use the same:
- Pivot formula.
- Session cutoff.
- Entry rules.
- Stops.
- Targets.
- Spread and commissions.
Changing formulas or session definitions after seeing the results can create hindsight bias.
Track Which Levels Matter to the Strategy
A trading journal can record whether trades occurred around PP, R1, R2, S1, S2, or another pivot.
This can show whether some levels add useful information under the strategy's actual market conditions.
Conclusion
Pivot points provide an objective method for calculating potential support and resistance from previous market data. The traditional Forex Pivot Point uses the prior high, low, and close, while alternative methods such as Fibonacci, Camarilla, Woodie, and DeMark use different formulas.
The value of pivot points comes from providing predefined reference levels rather than predicting price movement. Price above the central Pivot Point can support a bullish intraday bias, while price below it can support a bearish bias, but neither condition guarantees the next direction.
Support and resistance labels should also be interpreted carefully. S1 is not automatically a buy level and R1 is not automatically a sell level. Traders can instead observe rejection, acceptance, breakout, retest, and wider market structure around each calculated price.
Forex traders also need to account for the decentralized structure of the spot market. Daily session cutoffs can differ between data providers, and volume used to evaluate a breakout can be broker-specific, venue-specific, or tick based rather than complete global Forex volume.
A complete pivot-point strategy therefore defines the calculation method, session boundary, market condition, entry trigger, invalidation, position size, exit rules, and costs before evaluating results.
FAQs
What Are the Best Timeframes for Using Pivot Points?
There is no universally best chart timeframe. Daily pivots are commonly used for intraday trading, while weekly and monthly pivots can provide broader reference levels for longer holding periods.
A 15-minute, 30-minute, or one-hour chart is not inherently more reliable than another timeframe. The appropriate choice depends on the strategy, trade frequency, spread, volatility, and holding period.
Can Pivot Points Be Used in Other Markets Besides Forex?
Yes. Pivot formulas can be applied to stocks, futures, commodities, cryptocurrencies, and other instruments with suitable price data.
Performance and session definitions vary between markets, so results should be evaluated separately.
How Reliable Are Pivot Points for Predicting Price Movements?
Pivot points should not be assigned a universal reliability percentage. They identify predetermined reference levels but do not predict whether price will reverse, break out, or continue.
Any measurable effectiveness depends on the complete trading strategy and historical testing.
Do Pivot Points Work in All Market Conditions?
Pivot points can be calculated under any market condition, while their trading usefulness can change.
Strong trends can move through several pivot levels, ranges can produce repeated reactions, and major news can cause price to move well beyond levels calculated from the previous period.
Can I Use Pivot Points for Swing Trading?
Yes. Weekly or monthly pivot calculations can provide reference levels for swing or position trading.
Daily pivots are commonly associated with intraday strategies, but pivot analysis is not restricted to day trading.
Is Price Above the Pivot Point Always Bullish?
No. Price above PP is commonly treated as a bullish bias within pivot-point strategies, but the market can reverse and trade below it. The Pivot Point should be combined with actual price structure and risk management.
Which Pivot Point Method Is Best?
There is no single best method. Standard, Fibonacci, Woodie, Camarilla, and DM calculations produce different levels. The preferred method should be selected according to clearly defined trading rules and tested consistently.
Why Do Pivot Levels Differ Between Platforms?
Differences can result from the pivot formula, daily session cutoff, price feed, timeframe, or implementation. Woodie pivots are a good example because different platforms use different versions of the formula.
Do Pivot Levels Guarantee Support and Resistance?
No. They are potential support and resistance references. Price can reverse around them, consolidate, or move directly through them.
Add a comment
Leave your thoughts