
Bollinger Bands: A Complete Guide for Forex Trading

Time to read: 16 minutes

Learn how to use Bollinger Bands for Forex trading. Discover strategies, tips, and real-life examples to improve your trading skills and manage market volatility.
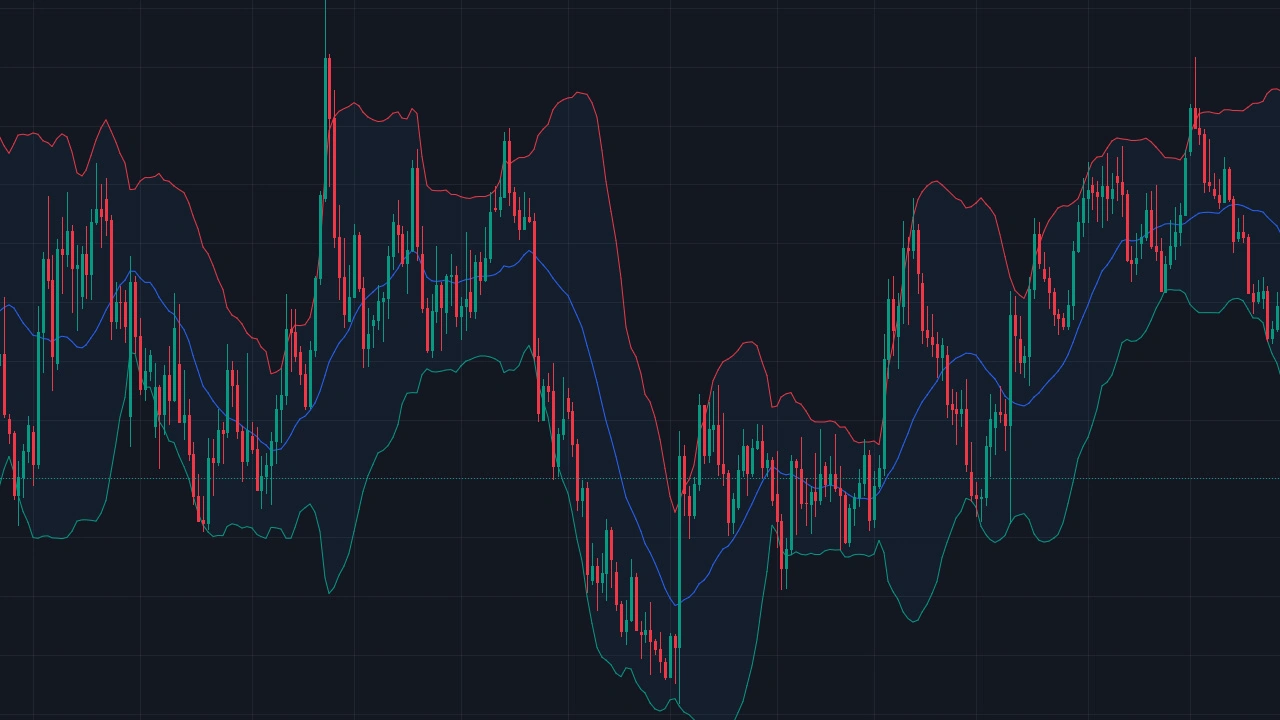
Bollinger Bands Indicator

Bollinger Bands in Forex trading are a volatility-based technical analysis tool used to evaluate where price is trading relative to a moving average and its recent dispersion. The indicator consists of a middle moving average and two outer bands that expand and contract as measured volatility changes.

Bollinger Bands do not predict reversals, breakouts, or future direction by themselves. A touch of the Upper Band is not automatically a sell signal, and a touch of the Lower Band is not automatically a buy signal. Their main purpose is to provide a relative definition of high and low while showing how volatility changes over time.

This guide explains the Bollinger Bands indicator, its calculation, default settings, BandWidth, %b, Bollinger Band Squeeze setups, trend behavior, breakout strategies, combinations with RSI, limitations, and practical Forex examples.

Introduction to Bollinger Bands

What Bollinger Bands Measure

Bollinger Bands combine a moving average with standard deviation to create an adaptive envelope around price.

The bands answer a straightforward technical question: is the current price relatively high or relatively low compared with its recent trading range and volatility?

The indicator can help traders analyze:

  • Relative price location.
  • Changes in volatility.
  • Trend behavior.
  • Volatility contraction.
  • Breakout conditions.
  • Price patterns such as M tops and W bottoms.

What Bollinger Bands Do Not Show

Bollinger Bands do not establish that price is fundamentally overvalued or undervalued.

They also do not determine whether price must reverse simply because it reaches an outer band.

The Upper and Lower Bands describe price relative to recent volatility. The trading interpretation comes from the broader trend, price structure, momentum, and the specific strategy being used.

Bollinger Bands in Forex Trading

Bollinger Bands can be applied to currency pairs across intraday and higher timeframes.

The same calculation can be used on a five-minute EUR/USD chart, an hourly GBP/USD chart, or a daily USD/JPY chart. The meaning of the signal changes with the timeframe because each bar represents a different amount of market activity.

Who Invented Bollinger Bands?

John Bollinger and the Development of the Indicator

Bollinger Bands were developed by John Bollinger in the early 1980s.

Bollinger was looking for trading bands that could adapt automatically as volatility changed. Earlier percentage-based envelopes maintained a fixed distance around a moving average, while Bollinger used standard deviation to make the band width respond dynamically to recent price behavior.

Why Standard Deviation Was Used

Standard deviation measures how dispersed price observations are around their average.

When price becomes more variable, standard deviation generally rises and the bands widen. When price variation decreases, standard deviation falls and the bands contract.

This adaptive structure is the central feature of Bollinger Bands.

Bollinger on Bollinger Bands

John Bollinger later documented the indicator and its applications in Bollinger on Bollinger Bands.

The indicator has since become widely available across Forex trading platforms and technical analysis software.

Understanding Bollinger Bands Structure

Middle Band

Traditional Bollinger Bands use a 20-period Simple Moving Average as the Middle Band.

The formula is:

Middle Band = 20-Period SMA

The 20-period setting is a default rather than a universal requirement.

Upper Band

The Upper Band is normally positioned two standard deviations above the Middle Band:

Upper Band = Middle Band + (2 × Standard Deviation)

Price near the Upper Band is relatively high compared with its recent distribution.

This does not mean that price is automatically overbought or ready to decline.

Lower Band

The Lower Band is normally positioned two standard deviations below the Middle Band:

Lower Band = Middle Band - (2 × Standard Deviation)

Price near the Lower Band is relatively low compared with its recent distribution.

A Lower Band touch is not automatically an oversold buy signal.

Why the Bands Expand and Contract

Standard deviation changes as price variability changes.

Increasing volatility generally causes the Upper and Lower Bands to move farther from the Middle Band. Declining volatility brings them closer together.

Band width therefore provides information about current volatility rather than future market direction.

Default Settings Are Only Defaults

The traditional configuration is:

  • 20 periods for the moving average.
  • 20 periods for the standard deviation calculation.
  • Two standard deviations above and below the moving average.

Different strategies can require different parameters, although settings should be selected through a consistent method rather than changed after observing the desired historical result.

How Bollinger Bands Work

Relative High and Low

The fundamental Bollinger Bands interpretation is relative rather than predictive.

Price near the Upper Band is high relative to the selected recent period. Price near the Lower Band is relatively low.

This information can then be compared with momentum, price action, market structure, or another independent analytical input.

Volatility Expansion

When market volatility increases, Bollinger Bands widen.

Expansion frequently occurs after price begins moving strongly, although wide bands do not establish that the current movement is about to continue or reverse.

Volatility Contraction

When volatility falls, the bands become narrower.

A period of unusually narrow BandWidth is commonly called a Bollinger Band Squeeze.

The Squeeze can identify a market transitioning from low volatility toward a possible expansion. It does not determine whether the eventual move will be bullish or bearish.

Walking the Band

During a strong trend, price can repeatedly trade near an outer Bollinger Band.

In an uptrend, price can move along the Upper Band. In a downtrend, it can repeatedly track the Lower Band.

This behavior is commonly called walking the band.

Selling every Upper Band touch or buying every Lower Band touch can therefore place a trader directly against a strong trend.

Closing Outside the Bands

A close beyond an outer band should not automatically be interpreted as an extreme that must reverse.

John Bollinger's own rules state that closes outside the bands are initially associated with continuation rather than reversal.

The subsequent price action determines whether the breakout develops or fails.

Bollinger Bands Calculation

Step 1: Calculate the Middle Band

Calculate the Simple Moving Average over the selected number of periods.

With the traditional setting:

Middle Band = SMA of the Previous 20 Closing Prices

Step 2: Calculate Standard Deviation

Calculate standard deviation using the same underlying price observations.

Standard deviation measures dispersion around the moving average.

Step 3: Calculate the Upper Band

With the standard settings:

Upper Band = 20-Period SMA + (2 × 20-Period Standard Deviation)

Step 4: Calculate the Lower Band

The Lower Band is:

Lower Band = 20-Period SMA - (2 × 20-Period Standard Deviation)

Simple Example

Assume the 20-period SMA for EUR/USD is 1.1000 and the calculated standard deviation is 0.0050.

Using a two-standard-deviation setting:

  • Upper Band = 1.1000 + (2 × 0.0050) = 1.1100.
  • Middle Band = 1.1000.
  • Lower Band = 1.1000 - (2 × 0.0050) = 1.0900.

These values change as new price data enters the calculation.

Do Not Assume 95% Price Containment

It is tempting to apply the normal-distribution rule and claim that approximately 95% of prices should remain within two standard deviations.

That interpretation should not be applied mechanically to Bollinger Bands. Financial price distributions are not necessarily normal, and the rolling sample used in the calculation is limited.

Standard deviation is being used to construct adaptive bands rather than to guarantee a specific statistical probability of remaining inside them.

How to Interpret Bollinger Bands

Overbought and Oversold Conditions

The terms overbought and oversold are often applied too aggressively to Bollinger Bands.

A more accurate interpretation is:

  • Upper Band = price is relatively high.
  • Lower Band = price is relatively low.

An Upper Band touch is not automatically a sell signal, and a Lower Band touch is not automatically a buy signal.

Trend Identification

Bollinger Bands can provide useful trend context when combined with price structure.

During bullish conditions, price can repeatedly reach the Upper Band while pullbacks remain above or around the Middle Band.

During bearish conditions, price can repeatedly reach the Lower Band while recoveries struggle around the Middle Band.

The bands themselves do not replace the underlying sequence of highs and lows used to define market structure.

The Middle Band

The Middle Band represents the moving average used to construct the indicator.

Price crossing the Middle Band does not automatically create a new trend or trading signal.

In a range, price can cross the Middle Band repeatedly. During a trend, the Middle Band can act as a useful reference for pullbacks.

BandWidth

BandWidth measures the distance between the Upper and Lower Bands relative to the Middle Band.

A simplified representation is:

BandWidth = (Upper Band - Lower Band) / Middle Band

Traders commonly use BandWidth to identify periods where volatility has contracted relative to previous readings.

%b

%b measures where price sits relative to the Bollinger Bands.

A simplified formula is:

%b = (Price - Lower Band) / (Upper Band - Lower Band)

  • %b around 1 means price is at the Upper Band.
  • %b around 0.5 means price is around the Middle Band.
  • %b around 0 means price is at the Lower Band.

Values can also move above 1 or below 0 when price trades beyond the bands.

Common Bollinger Band Strategies

Bollinger Band Squeeze Strategy

A Bollinger Band Squeeze develops when BandWidth contracts to a relatively low level.

This signals low measured volatility compared with the recent period.

A structured squeeze strategy can follow this sequence:

  1. Identify unusually narrow BandWidth.
  2. Mark nearby support and resistance.
  3. Wait for price to move outside the consolidation.
  4. Evaluate whether price maintains acceptance beyond the boundary.
  5. Define invalidation and position size before entry.

The Squeeze identifies volatility contraction. It does not forecast the direction of the eventual expansion.

Bollinger Band Breakout Strategy

A breakout strategy looks for price closing beyond an outer band alongside a break of relevant price structure.

The outer-band close can provide evidence of strong movement rather than an immediate reversal.

Traders can evaluate:

  • Whether the candle closes outside the band.
  • Whether support or resistance also breaks.
  • Whether subsequent candles show follow-through.
  • Whether the breakout quickly returns inside the previous structure.

Mean Reversion Strategy

Bollinger Bands can also be used in mean reversion strategies when the wider market is ranging.

The entry should not be based simply on touching an outer band.

A trader can instead require:

  • An established trading range.
  • Price reaching an outer band near a range boundary.
  • Rejection or failed continuation.
  • A price-action confirmation.

The same strategy can perform poorly during a strong directional trend, making market-regime identification important.

Bollinger W Bottom

Bollinger Bands can be used to analyze W-shaped bottoms.

One useful structure occurs when the first low reaches or moves beyond the Lower Band, followed by a recovery and a second low that remains inside the band or shows stronger relative momentum.

The pattern still requires price confirmation rather than assuming that the second low guarantees a bullish reversal.

Bollinger M Top

M-shaped tops use a similar idea in the opposite direction.

The first high can reach or exceed the Upper Band, while a later price high produces weaker relative band behavior.

Subsequent bearish structure is needed before treating the setup as a completed reversal.

Combining Bollinger Bands with Other Indicators

Bollinger Bands and RSI

RSI measures recent momentum on a scale from 0 to 100.

Combining RSI with Bollinger Bands can provide additional context, although the interpretation needs to remain cautious.

For example, price reaching the Upper Band while RSI is above 70 does not independently prove that EUR/USD is about to fall.

Strong trends can keep both price near the Upper Band and RSI at elevated levels for extended periods.

Example of a Range Setup

In an established range, a trader might look for:

  1. Price reaching the Lower Band near established support.
  2. RSI moving into a lower momentum range.
  3. Price failing to continue below support.
  4. A later bullish price trigger.

The market structure and confirmation create the setup. The indicators provide supporting information.

Bollinger Bands and Price Action

Price action can help distinguish a simple band touch from a meaningful structural setup.

Traders can monitor:

  • Support and resistance.
  • Swing highs and lows.
  • Breakout closes.
  • Failed breakouts.
  • Candlestick rejection.

Avoid Duplicate Confirmation

Adding several indicators does not automatically improve signal quality.

John Bollinger's own guidance recommends avoiding multiple indicators that measure essentially the same information.

A momentum indicator can provide different information from a volume or market-structure measure, while two similar momentum indicators can largely duplicate one another.

Limitations of Bollinger Bands

Bands Are Based on Historical Data

Bollinger Bands are calculated entirely from existing price observations.

They describe recent price and volatility behavior rather than independently predicting future prices.

False Signals

A setup can fail regardless of how closely it resembles a historical Bollinger Bands pattern.

A squeeze can break in one direction and reverse. A Lower Band rejection can continue lower. An Upper Band breakout can fail and return inside the bands.

Band Touches Are Not Signals

This is one of the most important limitations to understand.

Treating every Upper Band touch as overbought and every Lower Band touch as oversold creates repeated counter-trend signals during strong markets.

Standard Deviation Does Not Create Guaranteed Probabilities

Financial prices do not satisfy all of the assumptions required for a simple normal-distribution interpretation.

A move beyond two standard deviations should therefore not be described as statistically impossible, exceptionally rare under all conditions, or certain to revert.

Parameter Sensitivity

Different lookback periods and standard-deviation multipliers produce different bands.

Short settings react more quickly while producing more frequent changes. Longer settings are smoother while responding more slowly.

Parameters should be selected before evaluating results to reduce hindsight-driven optimization.

Bollinger Bands Do Not Measure Direction Directly

Band expansion indicates rising measured volatility, not whether price will move up or down.

Band contraction indicates lower volatility, not the direction of the next breakout.

Practical Tips for Trading with Bollinger Bands

Start With the Traditional Settings

The 20-period, two-standard-deviation configuration provides a useful starting point.

Adjustments should be tested rather than changed because one historical chart looks better with another setting.

Adjust Parameters Consistently

John Bollinger's published guidance notes that changing the moving-average length can also justify changing the standard-deviation multiplier when consistent price containment is the objective.

His examples include:

  • 20 periods with 2.0 standard deviations.
  • 50 periods with approximately 2.1 standard deviations.
  • 10 periods with approximately 1.9 standard deviations.

These remain guidelines rather than mandatory Forex settings.

Match the Strategy to the Market Condition

Do not apply the same Bollinger Bands logic to every market regime.

  • Trend: Outer-band walks and continuation setups can be more relevant.
  • Range: Mean reversion around boundaries can be evaluated.
  • Low volatility: Monitor for a Squeeze and later expansion.

Use Stop-Loss Orders as Part of a Risk Plan

Stops should reflect the price structure that invalidates the trade rather than being placed automatically at the Middle Band or outer band.

Standard stop orders can experience slippage, so they do not guarantee execution at the requested stop price.

Calculate Position Size After Defining the Stop

Position size should be determined after the entry and invalidation levels are established.

A wider technical stop requires a smaller position when the trader wants to maintain the same monetary risk.

Do Not Chase a Breakout

Price can move rapidly after a squeeze.

Entering substantially after the planned breakout can change the stop distance and available reward. The strategy should define whether late entries are permitted.

Real-Life Examples of Bollinger Bands in Action

Example 1: Bollinger Band Squeeze

Assume EUR/USD has traded inside a narrow consolidation and Bollinger BandWidth has fallen to a relatively low reading.

The contraction identifies a low-volatility environment.

EUR/USD later closes above both the Upper Band and nearby resistance. The next candle remains above the former resistance area.

The combination provides evidence of an upside volatility expansion. The Squeeze itself did not predict that the breakout would be bullish.

Example 2: Upper Band Walk

GBP/USD establishes higher highs and higher lows while repeatedly trading near the Upper Bollinger Band.

Selling the first Upper Band touch would place the trader against the developing trend.

The example demonstrates why an Upper Band tag should be interpreted as relative strength rather than an automatic overbought reversal.

Example 3: Failed Lower Band Reversal

USD/JPY declines sharply and touches the Lower Band.

A trader buys immediately because the pair appears oversold.

Price continues falling and begins walking down the Lower Band.

The trade fails because the band touch was used as a complete reversal signal without considering the bearish market structure.

Example 4: Range Mean Reversion

EUR/GBP trades between clearly defined support and resistance.

Price reaches the Lower Band near established support, briefly trades below the range boundary, and then closes back inside it.

A later break of a short-term swing high provides additional bullish evidence.

The setup combines range structure, relative price location, failed downside continuation, and price confirmation rather than relying on the Lower Band alone.

Frequently Asked Questions (FAQ)

What are Bollinger Bands best used for?

Bollinger Bands are primarily useful for defining relative high and low prices and measuring changes in volatility. They can support trend, breakout, mean-reversion, and pattern-recognition strategies when combined with appropriate trading rules.

What are the standard Bollinger Bands settings?

The traditional default is a 20-period Simple Moving Average with Upper and Lower Bands positioned two standard deviations above and below the average.

Does touching the Upper Bollinger Band mean sell?

No. An Upper Band touch means price is relatively high under the current calculation. During strong uptrends, price can repeatedly trade along the Upper Band.

Does touching the Lower Bollinger Band mean buy?

No. A Lower Band touch indicates that price is relatively low compared with the selected period. Strong downtrends can continue along the Lower Band.

What is a Bollinger Band Squeeze?

A Squeeze occurs when BandWidth contracts to a relatively low level, indicating reduced volatility. It can precede a volatility expansion, while it does not predict the direction of the eventual move.

Is a close outside the Bollinger Bands a reversal signal?

Not automatically. John Bollinger's published rules state that closes outside the bands should initially be treated as continuation behavior rather than immediate reversal signals.

Can Bollinger Bands be used with RSI?

Yes. RSI can add momentum information, while an Upper Band touch combined with RSI above 70 still does not guarantee a bearish reversal. Market structure and price confirmation remain important.

What is Bollinger BandWidth?

BandWidth measures the distance between the Upper and Lower Bands relative to the Middle Band. It is commonly used to identify periods of volatility contraction and expansion.

What is Bollinger %b?

%b measures where price is positioned relative to the bands. A value around 1 corresponds with the Upper Band, 0.5 with the Middle Band, and 0 with the Lower Band.

Are Bollinger Bands leading or lagging?

Bollinger Bands are calculated from historical price data. They describe current price location and volatility based on that history rather than independently forecasting future movement.

Do Bollinger Bands work on all Forex timeframes?

They can be calculated on many different timeframes. The timeframe should contain enough market activity to produce useful price information, and lower-timeframe strategies need to account more carefully for spread, commission, and execution costs.

Are two standard deviations guaranteed to contain 95% of Forex prices?

No. The normal-distribution 95% rule should not be applied mechanically to Bollinger Bands. Financial prices are not normally distributed in the simple way required for that interpretation, and the indicator uses a rolling sample.

Add a comment

Leave your thoughts

success