
Ichimoku Cloud Indicator: A Complete Guide for Forex Trading
Time to read: 21 minutes
Learn to use the Ichimoku Cloud for trend analysis, trading strategies, and market insights across forex and other markets with this comprehensive guide.
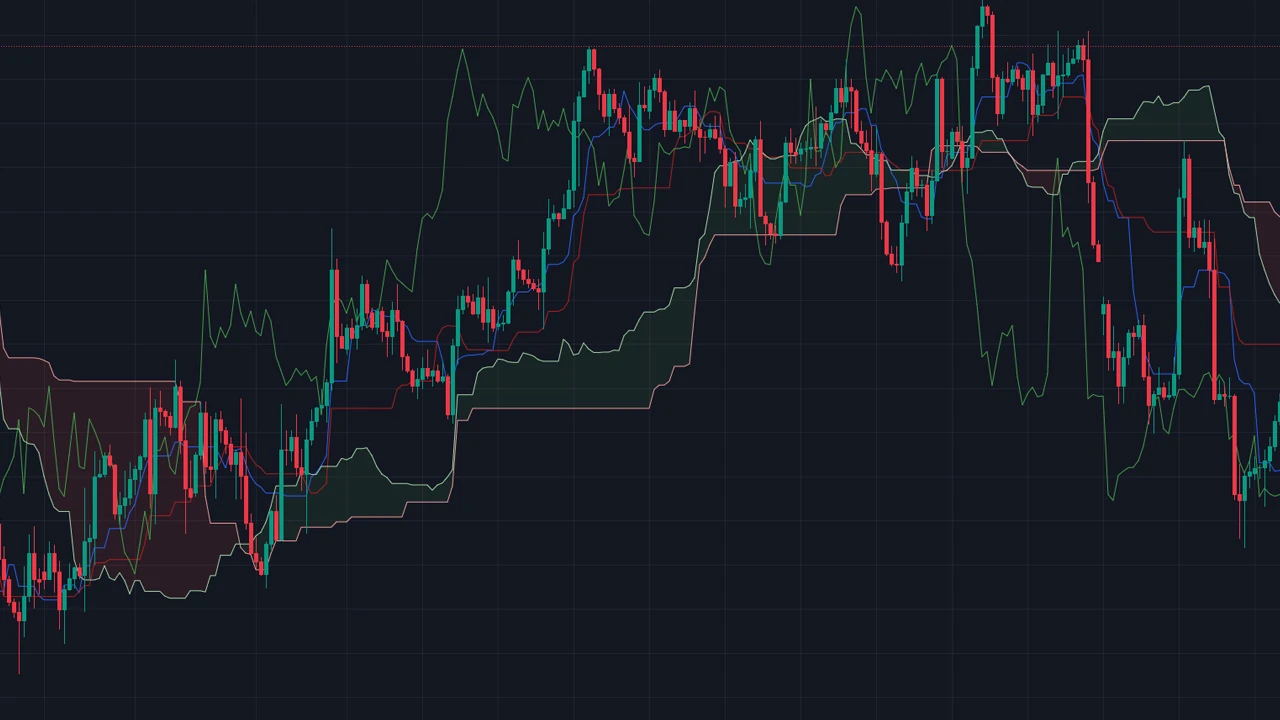
The Ichimoku Cloud indicator, or Ichimoku Kinko Hyo, is a technical analysis framework used to evaluate trend direction, price equilibrium, momentum relationships, and potential support and resistance areas. Instead of relying on a single moving average or oscillator, Ichimoku combines several calculated lines and a projected cloud on one chart.
Ichimoku does not predict future prices with certainty. Its forward-shifted cloud is created from information already available at the time of calculation, not from future market data. The indicator is most useful as a structured way to describe current market conditions and define trading rules that can be tested consistently.
This guide explains the traditional 9, 26, and 52-period Ichimoku calculations, the Tenkan-sen, Kijun-sen, Senkou Spans, Chikou Span, Kumo, common Forex trading strategies, limitations, combinations with other indicators, and practical risk-management considerations.
Introduction to the Ichimoku Cloud Indicator
What Is Ichimoku Kinko Hyo?
Ichimoku Kinko Hyo is a technical analysis system built around the relationship between recent price-range midpoints and their position on the chart.
The name is commonly translated along the lines of one-glance equilibrium chart, reflecting the objective of presenting several aspects of market structure in one view.
What the Indicator Shows
The traditional Ichimoku framework can help traders evaluate:
- Whether price is above, below, or inside the Kumo.
- The relationship between the Tenkan-sen and Kijun-sen.
- The current position of price relative to longer-range equilibrium levels.
- The relationship between the Chikou Span and historical price action.
- Potential support and resistance zones around the cloud and its component lines.
Ichimoku Is Not a Forecasting Machine
Although two of its lines are plotted forward, Ichimoku does not contain information from the future.
Senkou Span A and Senkou Span B are calculated from current and historical data and then shifted 26 periods to the right. Their future position is a charting convention that helps traders visualize current equilibrium levels ahead of price.
The projected cloud can therefore be used as a future reference zone without being interpreted as a prediction of where price must trade.
Ichimoku Works as a Framework
Individual Ichimoku signals should be interpreted within the wider structure.
A Tenkan-sen and Kijun-sen crossover, for example, means something different when price is clearly above the cloud than when price is moving repeatedly through a flat Kumo.
The indicator is best understood as a collection of related measurements rather than a series of automatic buy and sell signals.
History and Origin of the Ichimoku Cloud
Goichi Hosoda
Ichimoku Kinko Hyo was developed by Japanese journalist Goichi Hosoda, who also published under the name Ichimoku Sanjin.
Hosoda began developing the underlying method during the 1930s and continued refining the framework for decades before publishing his Ichimoku work in 1969.
Why the Traditional Periods Are 9, 26, and 52
The standard Ichimoku settings are:
- 9 periods for the Tenkan-sen.
- 26 periods for the Kijun-sen and displacement.
- 52 periods for Senkou Span B.
These traditional values developed in the context of the Japanese trading calendar of the period, when a six-day working week was common and approximately 26 trading days represented a month.
Traditional Settings Versus Modern Markets
Forex now trades continuously during the business week, while cryptocurrencies trade around the clock. Traders sometimes test alternative Ichimoku parameters to reflect different market structures.
Changing the settings is possible, but it also changes the indicator being tested. Results from 9, 26, and 52 should not automatically be assumed to apply to another parameter combination.
Historical Claims Should Be Kept Separate From Performance Claims
The length of time spent developing Ichimoku does not establish a universal statistical accuracy rate.
Modern performance still depends on the market, timeframe, trading rules, execution costs, risk management, and testing methodology.
Components of the Ichimoku Cloud
Five Lines, Plus the Cloud
Ichimoku is commonly described as having five plotted lines:
- Tenkan-sen.
- Kijun-sen.
- Senkou Span A.
- Senkou Span B.
- Chikou Span.
The Kumo is not a sixth calculated line. It is the shaded area between Senkou Span A and Senkou Span B.
1. Tenkan-sen (Conversion Line)
The traditional Tenkan-sen is calculated as:
Tenkan-sen = (Highest High over 9 Periods + Lowest Low over 9 Periods) / 2
This is an important distinction from a standard moving average. The Tenkan-sen does not average every closing price over nine periods. It calculates the midpoint of the highest high and lowest low within the selected range.
How to Read the Tenkan-sen
A rising Tenkan-sen shows that the midpoint of the recent nine-period range is increasing. A falling Tenkan-sen shows that the midpoint is declining.
A flat Tenkan-sen means the highest-high and lowest-low combination has produced the same midpoint over successive calculations.
None of these conditions independently guarantees momentum continuation or reversal.
2. Kijun-sen (Base Line)
The Kijun-sen uses the same midpoint calculation over a longer period:
Kijun-sen = (Highest High over 26 Periods + Lowest Low over 26 Periods) / 2
Because it uses a longer range, the Kijun-sen normally changes less frequently than the Tenkan-sen.
Kijun-sen as an Equilibrium Reference
Traders often use the Kijun-sen as a medium-term equilibrium reference.
Price above the Kijun-sen can support a bullish technical bias, while price below it can support a bearish bias. The line itself does not determine the complete trend.
Do Not Automatically Place Stops at the Kijun-sen
The Kijun-sen can be incorporated into trailing or exit rules, but a touch of the line does not automatically invalidate every trade.
Stop placement should reflect the rules of the strategy and the market structure being traded.
3. Senkou Span A (Leading Span A)
Senkou Span A is calculated as:
Senkou Span A = (Tenkan-sen + Kijun-sen) / 2
The resulting value is plotted 26 periods ahead.
It forms one boundary of the Kumo.
Why Senkou Span A Changes Faster
Span A is derived from the 9-period and 26-period measurements, so it generally reacts more quickly to changing market structure than Senkou Span B.
A rising Span A reflects an increasing midpoint between Tenkan-sen and Kijun-sen. It should not automatically be interpreted as proof that the future market will be bullish.
4. Senkou Span B (Leading Span B)
Senkou Span B is calculated as:
Senkou Span B = (Highest High over 52 Periods + Lowest Low over 52 Periods) / 2
It is also plotted 26 periods ahead.
Flat Senkou Span B
Senkou Span B often remains flat for extended periods because the highest high and lowest low of the 52-period window can remain unchanged.
A flat Span B does not automatically prove that the market is consolidating or lacks momentum. It simply shows that the midpoint of the relevant 52-period range has not changed.
5. Kumo (Cloud)
The Kumo is the area between Senkou Span A and Senkou Span B.
When Span A is above Span B, many platforms display a bullish-colored cloud. When Span A is below Span B, the cloud is commonly displayed in a bearish color.
The colors themselves are a charting convention and do not create a trading signal.
Cloud Thickness
The thickness of the Kumo is determined by the distance between Span A and Span B.
It should not be treated as a direct measurement of market volatility or as proof that support or resistance is strong.
A wider cloud creates a wider technical equilibrium zone. Price can still move through a thick cloud, while a thin cloud can still hold during a particular market move.
6. Chikou Span (Lagging Span)
The Chikou Span is:
Current Closing Price plotted 26 periods back
No additional averaging is performed.
What the Chikou Span Actually Compares
By shifting the current close backward, the chart allows traders to compare today's price with the market structure that existed 26 periods earlier.
A Chikou Span above historical price can support a bullish Ichimoku interpretation, while a Chikou Span below historical price can support a bearish interpretation.
The Chikou Span does not independently confirm that a trend must continue or that a reversal is imminent.
How to Interpret the Ichimoku Cloud
Begin With Price Relative to the Cloud
A common Ichimoku framework classifies market structure as:
- Price above the Kumo: Bullish technical bias.
- Price below the Kumo: Bearish technical bias.
- Price inside the Kumo: Less clearly directional or transitional conditions.
These classifications describe the indicator state rather than guarantee future direction.
Bullish and Bearish Signals
Tenkan-sen Above Kijun-sen
A Tenkan-sen crossover above the Kijun-sen is conventionally interpreted as bullish.
Within traditional Ichimoku analysis, a bullish crossover occurring above the cloud is generally considered better aligned with the broader bullish structure than one occurring below the cloud.
Tenkan-sen Below Kijun-sen
A Tenkan-sen crossover below the Kijun-sen is conventionally bearish.
A bearish cross below the cloud is similarly aligned with an existing bearish Ichimoku structure.
Alignment does not establish a universal success probability.
Reading the Kumo (Cloud)
The cloud can be treated as an area where the relationship between shorter and longer Ichimoku equilibrium measurements is visible.
Price entering the cloud can indicate that the previous directional structure has weakened or that the market is transitioning.
Price leaving the opposite side of the cloud can then be evaluated as a structural breakout.
A Cloud Break Is Not Automatically a Trend Reversal
A close above the Kumo provides bullish technical evidence, while a close below provides bearish evidence.
The breakout can still fail.
Traders can evaluate:
- Whether the close occurs clearly beyond the cloud.
- Whether subsequent price action follows through.
- The Tenkan-sen and Kijun-sen relationship.
- Chikou Span positioning.
- Wider support and resistance.
Future Kumo Does Not Predict the Future
The future Kumo is frequently misunderstood.
Span A and Span B are shown 26 periods ahead, but both are calculated entirely from information already known.
A future bullish-colored Kumo therefore shows how today's Ichimoku calculations are projected on the chart. It does not mean the indicator knows whether price will be higher 26 periods later.
The Role of the Chikou Span (Lagging Span)
The Chikou Span can provide historical context by showing whether the current close is above or below price action from 26 periods earlier.
Traders can also examine whether the shifted line has clear space or is interacting with historical candles and cloud structure.
A Chikou crossover should not be used as a standalone reversal signal.
Ichimoku Cloud Trading Strategies
Trend-Following Strategy
A trend-following Ichimoku strategy can require several conditions to align before entry.
A hypothetical bullish framework might require:
- Price above the Kumo.
- Tenkan-sen above Kijun-sen.
- Chikou Span above the relevant historical price structure.
- A pullback or price trigger that provides a defined entry.
These conditions establish a technical framework rather than guarantee that the trend will continue.
Pullback Toward Kijun-sen
During an established trend, a trader can monitor a retracement toward the Kijun-sen.
The strategy should require evidence that the broader structure remains intact rather than buying or selling automatically when price touches the line.
A deeper retracement can continue through Kijun-sen and into the cloud.
Breakout Strategy Using the Kumo
A Kumo breakout strategy attempts to participate when price moves from one side of the cloud to the other.
A bullish setup can require a completed close above the cloud, while a bearish setup can require a completed close beneath it.
Additional rules can define:
- Minimum distance beyond the Kumo.
- Tenkan-sen and Kijun-sen alignment.
- Price structure.
- Chikou Span position.
- Invalidation.
False Kumo Breakout
Price can move beyond the cloud and then return inside it.
Waiting for a close or subsequent follow-through can reduce some premature entries without eliminating failed breakouts.
Support and Resistance Zones Defined by the Cloud
Traders commonly use the cloud as a dynamic support or resistance reference in trending markets.
Rather than assuming the Kumo will hold, a trader can watch how price responds as it enters or approaches the zone.
Possible evidence includes:
- Rejection.
- Consolidation.
- Breakthrough.
- A new swing high or low.
Kumo Twist
A Kumo twist occurs when Senkou Span A crosses Senkou Span B.
This changes the cloud's bullish or bearish orientation.
A twist should not automatically be interpreted as a future market reversal because the spans are current calculations displaced forward.
Combining Strategies for Greater Accuracy
Combining several Ichimoku conditions can create a more selective trading system, but it does not automatically increase accuracy.
The effect of additional filters should be measured through backtesting and out-of-sample testing.
More conditions can reduce false trades while also removing profitable opportunities.
Risk Comes Before Signal Strength
A setup that appears strongly aligned with Ichimoku still requires:
- Predefined invalidation.
- Position sizing.
- Maximum account exposure.
- Realistic spreads and slippage.
Pros and Cons of Using the Ichimoku Cloud
Advantages of the Ichimoku Cloud
Several Market Relationships in One Framework
Ichimoku combines short, medium, and longer high-low midpoint calculations with current and displaced price relationships.
This allows traders to evaluate several aspects of market structure without placing numerous unrelated indicators on the chart.
Objective Calculations
Each Ichimoku line follows a predefined formula.
This makes the values reproducible when the same market data, timeframe, parameters, and platform implementation are used.
Clear Trend Classification
Price location relative to the cloud provides a straightforward method for defining bullish, bearish, and transitional technical conditions.
Dynamic Reference Zones
The Kumo, Kijun-sen, and Tenkan-sen can provide moving price references that automatically adjust as the selected high-low ranges change.
Multiple Market Applications
Ichimoku calculations can be applied to Forex, equities, futures, commodities, cryptocurrencies, and other markets with suitable high, low, and close data.
The same settings and strategy should not automatically be assumed to perform identically across all markets.
Limitations and Potential Drawbacks
Every Component Is Price Derived
Ichimoku does not introduce independent fundamental or order-flow information.
All of its standard components are calculated from historical price data.
Signals Can Arrive After Price Has Already Moved
A cloud breakout or Tenkan-Kijun alignment can occur after a substantial part of a move has already developed.
This is a normal consequence of using historical range calculations rather than evidence that the indicator is defective.
Choppy Conditions Can Produce Repeated Crosses
When price moves without a sustained trend, Tenkan-sen and Kijun-sen can cross repeatedly and price can move in and out of the cloud.
These conditions can produce frequent losing signals for trend-following strategies.
Cloud Thickness Is Easy to Overinterpret
A thick Kumo does not guarantee strong support or resistance, and a thin Kumo does not guarantee an easy breakout.
The Forward Shift Can Be Misunderstood
Plotting Senkou Spans ahead can make the indicator appear more predictive than it actually is.
The values contain no future market information.
Parameter Changes Affect the Entire Framework
Changing 9, 26, or 52 can materially alter crossover frequency, cloud shape, and signal timing.
Parameters should be tested systematically rather than optimized to fit selected historical examples.
Combining Ichimoku Cloud with Other Indicators
First Decide What Information Is Missing
Ichimoku already contains several price-based trend and equilibrium measurements.
Adding another indicator should serve a specific analytical purpose rather than simply make the chart look more confirmed.
Ichimoku Cloud and Relative Strength Index (RSI)
RSI measures recent momentum on a scale from 0 to 100.
Traditional readings above 70 and below 30 are commonly described as overbought and oversold, but these levels do not guarantee a reversal.
A Forex pair can remain above its Ichimoku Cloud while RSI stays elevated for an extended period during a strong trend.
Practical RSI Combination
Instead of rejecting every bullish Ichimoku setup because RSI is above 70, a trader can define exactly what RSI is intended to measure.
For example, the strategy might use RSI only to identify momentum recovery after a pullback.
Ichimoku Cloud and Moving Average Convergence Divergence (MACD)
MACD is calculated from exponential moving averages and provides another view of trend and momentum.
A bullish MACD crossover occurring while price is above the Kumo can create additional alignment, while it does not prove that the trade has a higher probability of success.
Both tools are derived from price, so their signals are not fully independent.
Ichimoku Cloud and Fibonacci Retracement Levels
Fibonacci retracement levels can provide additional price references during a pullback.
A Fibonacci level overlapping the Kijun-sen or Kumo can create technical confluence.
The overlap does not create a known probability of reversal and should not be described as a high-probability trade without strategy-specific evidence.
Ichimoku and Price Action
Price structure can provide a useful complement to Ichimoku.
A trader can combine cloud location with:
- Higher highs and higher lows.
- Lower highs and lower lows.
- Support and resistance.
- Breakout and retest behavior.
Avoid Duplicate Confirmation
Several indicators agreeing does not necessarily mean that several independent sources of information support the trade.
Ichimoku, MACD, moving averages, and RSI are all calculated from price and can respond to the same underlying movement.
Practical Examples and Case Studies
Example 1: Bullish Trend Reversal
Assume EUR/USD has been trading beneath its Kumo.
Price later moves into the cloud and eventually closes above its upper boundary. Tenkan-sen moves above Kijun-sen, while the Chikou Span is positioned above the relevant historical price action.
This combination creates a bullish Ichimoku structure.
It does not establish that EUR/USD has permanently reversed. A trader still needs an entry rule, invalidation, stop distance, and position size.
Example 2: Bearish Continuation
GBP/USD remains beneath the Kumo while Tenkan-sen stays below Kijun-sen.
A rally toward the Kijun-sen fails to establish a new structural high, and price subsequently breaks a short-term swing low.
The setup combines bearish Ichimoku alignment with price structure rather than selling simply because GBP/USD is below the cloud.
Example 3: Consolidation and False Breakouts
USD/JPY trades repeatedly through a relatively flat Kumo.
Tenkan-sen and Kijun-sen cross several times and price produces short-lived breaks from both sides of the cloud.
A trend-following strategy can classify these conditions as unsuitable and remain out of the market until a clearer structure develops.
Example 4: Kumo Breakout Failure
EUR/JPY closes above the Kumo and initially appears to establish a bullish breakout.
The following candles fail to extend higher and price returns inside the cloud.
The original breakout thesis is reassessed according to the predefined invalidation rule.
The failed breakout demonstrates why a close beyond the cloud is evidence rather than certainty.
Example 5: Kijun-sen Pullback
AUD/USD is above the cloud and maintains a sequence of higher highs and higher lows.
Price pulls back toward the Kijun-sen. Rather than buying immediately, the trader waits for the pullback to stabilize and for short-term bullish structure to return.
The Kijun-sen defines the area being monitored, while price behavior determines whether the setup becomes tradable.
Common Mistakes to Avoid When Using Ichimoku
Relying Solely on Ichimoku Signals
Ichimoku can form a complete technical framework, but no price-based indicator removes uncertainty.
Risk limits, execution costs, economic events, and the strategy's tested performance remain important even when every Ichimoku condition aligns.
Counting the Cloud as a Sixth Independent Indicator
The standard Ichimoku system has five plotted lines.
The Kumo is the area created between the two Senkou Spans rather than a separate sixth calculation.
Treating Tenkan-sen and Kijun-sen as Ordinary Moving Averages
These lines are frequently called moving-average-like indicators, but their formulas use high-low midpoints rather than averages of each closing price.
Understanding that distinction helps explain why they can remain flat even while individual closing prices continue changing.
Overlooking the Kumo’s Thickness
Cloud thickness can be observed, but it should not be assigned more meaning than the calculation supports.
A wide cloud means the two Senkou values are farther apart. It does not prove that support or resistance will be stronger.
Misinterpreting Choppy Markets
Repeated movement through the cloud is a warning that a trend-following Ichimoku system can face frequent whipsaws.
Traders should define how their strategy identifies and responds to these conditions rather than assuming another indicator can remove every false signal.
Ignoring the Chikou Span
Traders using the traditional full framework can include Chikou Span positioning as an additional context filter.
Its value comes from comparing the current close with historical structure, not from revealing hidden future direction.
Entering Trades Without Confirmation
Additional confirmation can reduce trade frequency and help define entries, but it does not guarantee better performance.
The impact of Tenkan-Kijun alignment, Chikou positioning, candle closes, or additional indicators should be tested rather than assumed.
Treating the Future Kumo as Future Data
This creates one of the most serious analytical errors when using Ichimoku.
The cloud plotted ahead contains only current and historical calculations. It must not be interpreted as knowledge of future support, resistance, or price movement.
Creating Look-Ahead Bias in Backtests
Ichimoku displacement can create programming mistakes during historical testing.
Senkou Spans must be calculated using only information available at the time and then displayed forward. Chikou Span is the current close displayed backward.
A backtest that accidentally treats visually shifted values as information that was available earlier can introduce look-ahead bias and produce unrealistic results.
Assuming More Indicators Mean More Accuracy
Adding RSI, MACD, Fibonacci levels, moving averages, or candlestick patterns does not automatically increase the probability of success.
Each additional rule should demonstrate a useful contribution when tested with realistic trading costs.
Conclusion and Final Thoughts
Ichimoku Kinko Hyo provides a structured method for analyzing trend direction, price equilibrium, and potential support and resistance through five calculated lines and the Kumo created between the two leading spans.
The traditional framework uses 9 periods for Tenkan-sen, 26 for Kijun-sen and the chart displacement, and 52 for Senkou Span B. Tenkan-sen and Kijun-sen are high-low midpoint calculations rather than conventional closing-price moving averages.
Senkou Span A and Senkou Span B are projected 26 periods ahead, but the projection contains no future market information. The future Kumo shows today's calculated equilibrium relationships shifted forward on the chart.
Price above the Kumo can be classified as bullish within an Ichimoku framework, while price below it can be classified as bearish. Price inside the cloud normally provides less directional clarity. These classifications are technical conditions rather than guaranteed forecasts.
The cloud should also be interpreted carefully. A thick Kumo does not guarantee strong support or resistance, and a thin Kumo does not guarantee an easy breakout. The cloud width simply reflects the distance between Senkou Span A and Senkou Span B.
Traders using Ichimoku should define exact entry, invalidation, position-sizing, and exit rules and test them across a meaningful historical sample. Combining additional indicators can add context, but it should not be assumed to increase accuracy without supporting evidence.
Ichimoku is therefore best treated as a technical framework for organizing price information rather than a predictive system. Its usefulness depends on how clearly its rules are defined, how realistically they are tested, and how consistently risk is controlled when a signal fails.
Frequently Asked Questions (FAQs)
What is the best time frame for using the Ichimoku Cloud?
There is no universally best timeframe. Ichimoku can be calculated on intraday, daily, weekly, and other charts.
Higher timeframes contain broader price movements while lower timeframes produce more frequent signals and make spreads, commissions, and execution costs more important. Higher timeframes should not automatically be described as more reliable.
Can Ichimoku be used for stocks and commodities?
Yes. The calculations can be applied to Forex, stocks, futures, commodities, cryptocurrencies, and other instruments with suitable price data.
The performance of one Ichimoku strategy can differ across markets and should be tested separately.
Is the Ichimoku Cloud suitable for beginners?
Beginners can learn Ichimoku, although its five lines and displaced calculations make it more complex than a single moving average or oscillator.
Learning the formulas first makes the chart easier to interpret and reduces the risk of treating each line as an independent buy or sell signal.
How do I backtest the Ichimoku Cloud strategy?
Define the complete rules before testing, including:
- Ichimoku parameters.
- Entry conditions.
- Exit conditions.
- Invalidation.
- Position sizing.
- Spread.
- Commission.
- Slippage.
Special care is required with the displaced Senkou and Chikou lines so that the test does not accidentally use future information.
Can the Ichimoku Cloud predict future price movements?
No. Ichimoku uses historical and current price information to describe technical structure.
The Senkou Spans are displayed ahead of current price, but their values are calculated from information already known. They do not contain future price data.
How many components does Ichimoku have?
The traditional indicator has five plotted lines: Tenkan-sen, Kijun-sen, Senkou Span A, Senkou Span B, and Chikou Span.
The Kumo is the shaded area between the two Senkou Spans rather than an additional independent line.
Is the Ichimoku Cloud a moving-average system?
Not in the conventional sense. Tenkan-sen, Kijun-sen, and Senkou Span B use the midpoint of the highest high and lowest low over their respective lookback windows instead of averaging every closing price.
Does a thick Kumo mean stronger support or resistance?
Not necessarily. A thick Kumo means Senkou Span A and Senkou Span B are farther apart. Traders may treat the cloud as a wider support or resistance zone, but thickness does not guarantee that price will fail to break through it.
What does price inside the cloud mean?
Within the traditional framework, price inside the Kumo normally indicates less clearly directional or transitional conditions compared with price clearly above or below the cloud.
Does a Tenkan-sen and Kijun-sen crossover guarantee a new trend?
No. A crossover provides a technical signal within the Ichimoku framework. It can fail, particularly during sideways or choppy markets.
Add a comment
Leave your thoughts