
Market Profile: Understanding Market Auction Theory
Time to read: 27 minutes
Master Market Profile and Auction Theory to enhance your forex trading skills by learning key concepts, practical strategies, and techniques for more informed decision-making.
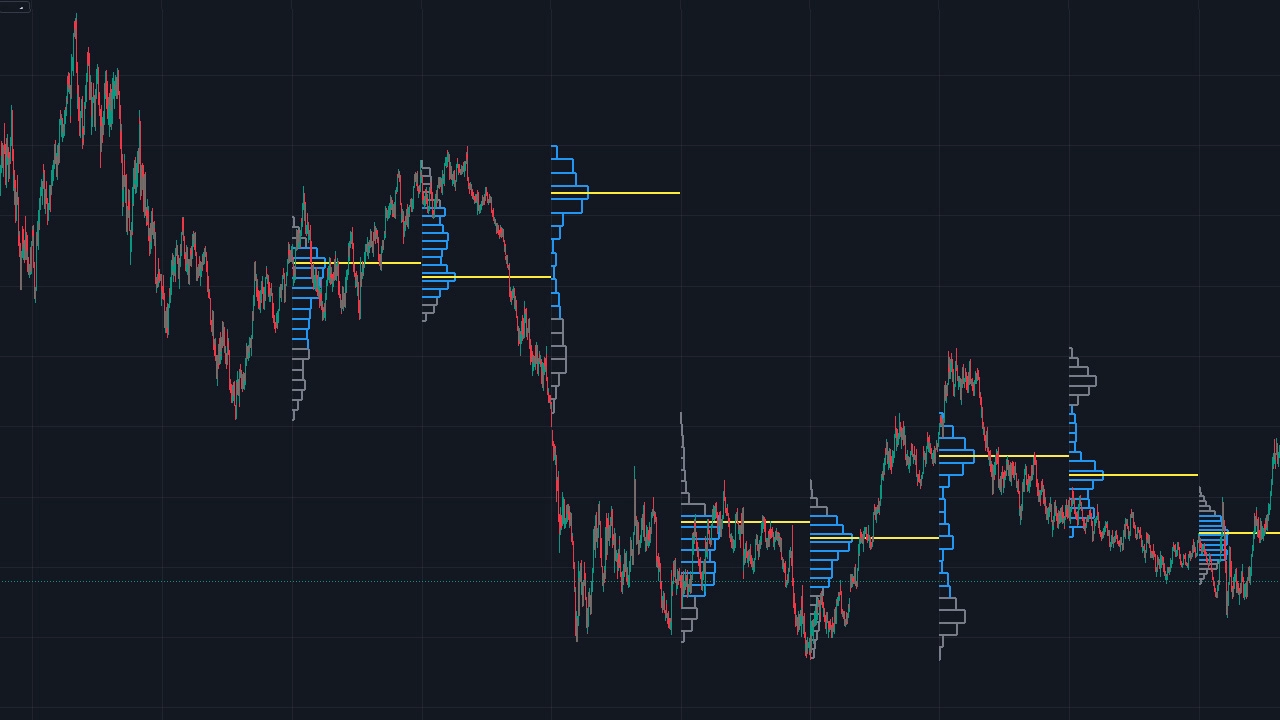
Market Profile in Forex trading is a way of organizing price and time to show where a market spent more or less of a defined session. Instead of displaying price only from left to right like a conventional candlestick chart, a traditional Market Profile builds a distribution from Time Price Opportunities, or TPOs.
Market Profile is commonly analyzed through the framework of Auction Market Theory, which treats markets as two-sided auctions continually searching for prices that facilitate trade. Concepts such as the Value Area, Point of Control, Initial Balance, single prints, excess, balance, and range extension help describe how that auction developed.
Market Profile should not be confused with Volume Profile. Traditional Market Profile measures time at price through TPOs, while Volume Profile measures volume traded at price. The distinction is particularly important in spot Forex because the global FX market is decentralized and does not have one complete centralized transaction-volume feed.
1. Introduction to Market Profile and Auction Theory
What Is Market Profile?
Market Profile is a charting framework developed by J. Peter Steidlmayer while he was associated with the Chicago Board of Trade. Steidlmayer joined the CBOT in 1963 and served on its Board of Directors from 1981 to 1983. Market Profile was developed and introduced through the CBOT during the 1980s.
The traditional profile organizes a trading session according to:
- Price.
- Time spent trading at each price.
- The distribution formed by those observations.
A standard implementation commonly divides a session into 30-minute periods. Each period receives a letter or block. When price trades at a level during that period, a TPO is recorded at that price.
What Is Auction Market Theory?
Auction Market Theory is a framework for interpreting how buyers and sellers interact through a two-sided auction.
The market moves between prices as participants search for levels where transactions can occur. Some prices attract repeated trading and produce a more developed profile, while other prices are visited briefly before the market moves elsewhere.
Within this framework, traders commonly describe:
- Balance: Price repeatedly rotates through a relatively developed area.
- Imbalance: Price moves directionally in search of another trading area.
- Acceptance: The market spends multiple TPO periods around a price region.
- Rejection: Price visits an area briefly and moves away.
Market Profile Describes Rather Than Predicts
Market Profile is better treated as a way of organizing market information than as a forecasting system.
A Value Area, POC, single print, or Initial Balance does not establish where price must move next. These features describe what happened during the auction and can be incorporated into a strategy with separate entry, invalidation, and risk rules.
Applying Market Profile to Forex
Market Profile was developed in exchange-traded markets, while the global spot Forex market has a different structure.
Spot FX is primarily an over-the-counter market with trading fragmented across dealers, electronic platforms, liquidity providers, and internal dealer pools.
A TPO-based Forex Market Profile can still organize price and time because those inputs are available from a Forex price feed.
Volume and order-flow interpretations require more care. Broker-specific or venue-specific volume should not be presented as complete global Forex trading activity.
Define the Forex Session First
Forex trades continuously during the business week rather than through one universal exchange session.
A Forex trader using daily Market Profiles therefore needs to define the session boundary. Different session definitions can change:
- The profile high and low.
- Initial Balance.
- TPO POC.
- Value Area High.
- Value Area Low.
The session definition should remain consistent when testing a strategy.
2. Basic Concepts of Auction Market Theory
Understanding Market Auctions: Buyers vs. Sellers
Every completed transaction contains both a buyer and a seller. Price does not rise simply because there are numerically more buyers than sellers.
A more useful distinction is between aggressive trading and available liquidity.
Aggressive buyers transact against available offers. Aggressive sellers transact against available bids. When transactions consume available liquidity and the market cannot continue trading at the same price, execution can move to another level.
Price Discovery
Auction Market Theory treats price as part of a discovery process.
When a price facilitates sustained two-sided trade, the profile can develop horizontally around that region. When the market rapidly moves away, it can indicate that participants were unwilling to continue trading there under the prevailing conditions.
Fair Value and Price Rejection
The word value has a specific meaning within Market Profile and should not be confused with an asset's intrinsic or fundamental fair value.
In a TPO profile, value generally refers to an area where the market spent a relatively large portion of the profiled session.
It is therefore more accurate to describe the Value Area as an area of time-based price acceptance than as the objectively correct value of a currency.
Price Rejection
Rejection describes price moving through or into an area without developing much time-based activity there.
A rapid move away can create:
- Single-print areas.
- Excess at a session extreme.
- Thin sections of a TPO profile.
Rejection does not guarantee that the same price will hold when revisited later.
Acceptance Is Not Permanent
A well-developed profile area shows where trading occurred during the measured session.
New economic information, monetary-policy expectations, liquidity changes, or large order flow can shift the auction elsewhere.
Yesterday's accepted price can therefore become irrelevant to today's developing market.
The Role of Time in Auction Market Theory
Traditional Market Profile uses time as its primary organizing variable.
Suppose EUR/USD trades at 1.1000 during six separate 30-minute brackets and at 1.1050 during only one bracket.
The TPO profile records more time-based activity at 1.1000 even when the actual transaction volume at the two prices is unknown.
Time at Price Is Not Volume at Price
This distinction is critical.
A price can have several TPOs but relatively little traded volume, or one TPO with substantial transaction volume.
Market Profile and Volume Profile can therefore produce different POCs and different Value Areas from the same session.
3. Components of a Market Profile
Price, Volume, and Time: The Three Pillars
Market Profile analysis is often discussed alongside price, time, and volume, although traditional TPO Market Profile itself is primarily a price-and-time distribution.
Price
Price forms the vertical axis of the profile.
Every row represents a defined price increment according to the instrument and chart settings.
Time
The trading session is divided into subperiods, traditionally 30 minutes.
Each subperiod contributes one TPO at every price level traded during that interval.
Volume
Volume can be displayed alongside a TPO profile, but it is a separate measurement.
In centralized futures markets, exchange-reported transaction volume can be analyzed by price.
In spot Forex, volume information can be broker-specific, venue-specific, or based on tick activity. It does not represent every global FX transaction.
Profile Structures: Value Area, Point of Control, and Range
TPO Value Area
The traditional TPO Value Area generally contains approximately 70% of the session's TPOs.
It is commonly calculated outward from the TPO Point of Control until approximately 70% of the profile's TPO observations are included.
Its boundaries are:
- VAH: Value Area High.
- VAL: Value Area Low.
TPO Point of Control
The traditional TPO POC is the price level containing the greatest number of TPOs.
It is therefore the price where the profile recorded the greatest time-based concentration under the selected settings.
Volume Point of Control
A Volume Point of Control, commonly abbreviated VPOC, is different.
VPOC is the price where the greatest transaction volume was recorded in a Volume Profile.
TPO POC and VPOC can occur at different prices.
Volume Value Area
Some platforms can calculate a Value Area from volume instead of TPO counts.
When that option is used, the resulting levels should be described as a volume-based Value Area rather than traditional TPO value.
Session Range
The session range extends from the highest price to the lowest price traded during the selected profile period.
A larger range indicates a larger high-to-low movement for that session, although one day's range alone is not a complete measurement of market volatility.
Market Profile Charts: How to Read Them
Traditional Market Profile charts use letters or blocks representing Time Price Opportunities.
For example:
- A can represent the first 30-minute bracket.
- B can represent the second.
- C can represent the third.
The exact lettering convention and bracket duration can be configured on modern platforms.
Profile Shape Is Descriptive
A relatively symmetrical profile can show that the session spent substantial time rotating around a central area.
An elongated or multi-distribution profile can accompany directional development.
Profile shape should not be used to forecast the next session automatically. Day types are descriptions of how a session developed rather than guaranteed templates for what follows.
Single Prints
An interior single-print area consists of prices containing only one TPO where surrounding portions of the profile contain greater TPO development.
It indicates that the market moved relatively quickly through those prices in time-based terms.
A single print is not the same thing as:
- A price gap.
- A low-volume node.
- An untraded price.
Significant volume can theoretically trade during a single TPO period even though only one TPO is recorded there.
4. Market Profile Terminology
Initial Balance (IB)
In traditional Market Profile terminology, the Initial Balance generally refers to the range established during the first two TPO periods.
With 30-minute TPO brackets:
Initial Balance = First Hour High to First Hour Low
Modern software can allow other Initial Balance durations, so the setting should be defined explicitly.
Initial Balance Width
A narrow Initial Balance provides a smaller opening range from which later range extension can occur.
A wide Initial Balance already incorporates more price movement.
Neither condition determines the eventual day type.
A narrow IB does not guarantee a Trend Day, and a wide IB does not guarantee that price will remain range bound.
Range Extension
Range extension occurs when price moves beyond the Initial Balance high or low later in the session.
Extension on one side can accompany directional development. Extension on both sides can be associated with neutral-type structures.
The market can also move outside the IB and later return, so the first break alone is not necessarily a trade signal.
Value Area (VA)
In a traditional TPO profile, the Value Area contains approximately 70% of the session's TPO observations.
VAH and VAL describe the boundaries of this calculated area.
They can be monitored as technical references without assuming they are guaranteed support or resistance.
Point of Control (POC)
In a traditional TPO Market Profile, POC is the price with the highest TPO count.
Some trading software also displays a VPOC based on transaction volume.
The two should not be used interchangeably.
POC Is Not a Guaranteed Price Magnet
Traders frequently describe POC as a magnet because price can revisit previously developed areas.
This is a trading hypothesis rather than a mechanical market rule.
A strong directional move can leave a previous POC behind without returning during the relevant trading horizon.
Time Price Opportunity (TPO)
A TPO records that price traded at a particular level during a defined time bracket.
It does not count:
- The number of trades.
- Contract volume.
- The number of buyers.
- The number of sellers.
Excess
In Market Profile terminology, excess generally refers to a tail of single TPOs at an extreme of the profile.
It represents limited time spent around the extreme before price moved away.
Excess can be interpreted as rejection within the auction framework without assuming that the level will remain support or resistance permanently.
Excess Is Not Simply a Candlestick Wick
A candlestick wick and Market Profile excess can occur around the same price movement, but they are defined differently.
Excess is identified from the TPO distribution rather than from the appearance of one candlestick.
5. Understanding Market Profile Structures
Types of Market Profile Days
Market Profile practitioners commonly classify completed sessions according to how the Initial Balance, range extension, TPO distribution, and directional development evolved.
Normal Day
A traditional Normal Day generally develops a relatively wide Initial Balance and limited range extension outside it.
Much of the session remains contained around the opening range.
Normal Variation Day
A Normal Variation Day typically extends meaningfully beyond the Initial Balance in one direction while maintaining more two-sided development than a classic Trend Day.
Trend Day
A Trend Day generally contains sustained directional range extension, limited counter-directional rotation, and repeated progression in one direction.
It can begin from a relatively narrow Initial Balance, although a narrow IB alone does not predict that a Trend Day will occur.
Non-Trend Day
A Non-Trend Day typically develops a relatively narrow total session range with limited range extension.
It describes a session that failed to develop significant directional movement.
Neutral Day
A Neutral Day generally extends beyond both sides of the Initial Balance.
This indicates that both upward and downward range exploration occurred during the session.
The exact closing location can provide additional context but should not be used as the sole definition.
Day Types Are Usually Easier to Identify After Development
One of the major risks in Market Profile trading is deciding too early that a session is a Trend Day, Normal Day, or Neutral Day.
The profile changes throughout the session.
Day-type classification should therefore be treated as a developing hypothesis rather than a label that determines subsequent market behavior.
Identifying Key Trading Levels
Common Market Profile references include:
- Previous session VAH.
- Previous session VAL.
- Previous TPO POC.
- Current developing POC.
- Initial Balance high and low.
- Session high and low.
- Single-print areas.
- Excess tails.
These are reference prices rather than automatically reliable support and resistance.
Single Prints and Excess
Interior single prints and excess at a profile extreme are related but not identical concepts.
Interior single prints identify prices that received only one TPO during a directional portion of the auction.
At the top or bottom of the profile, a sequence of single TPOs can form an excess tail.
Single Prints Do Not Have to Be Filled
Traders sometimes expect the market to return and completely fill every single-print area.
That should not be treated as a rule.
A single-print region can later be revisited, partially filled, completely traversed, or remain untouched for an extended period.
Poor Highs and Poor Lows
Some Market Profile frameworks also distinguish profile extremes without clear excess.
These are sometimes called poor highs or poor lows.
Traders can monitor them as unfinished-looking auction structures, although a later revisit is not guaranteed.
6. Market Profile and Trading Strategies
Using Market Profile to Identify Trading Opportunities
Market Profile can help define where a trade will be considered rather than automatically telling the trader what position to open.
A complete setup can combine:
- Market context.
- A profile reference.
- Actual price behavior.
- A defined entry trigger.
- Structural invalidation.
- Position sizing.
Value Area Rejection Strategy
Assume EUR/USD approaches the previous session's VAH.
A trader does not automatically sell the level.
Instead, the setup can require price to trade above VAH, fail to maintain that move, and return inside the previous Value Area.
Further bearish price structure can then provide an entry trigger.
Returning inside value does not guarantee that price will continue to POC or VAL.
Value Area Acceptance Strategy
Price can also move outside a previous Value Area and continue developing TPOs beyond it.
This can be interpreted as evidence that the current session is establishing activity away from the previous value region.
A trader can use that observation in a continuation framework without claiming that the new area represents permanent fair value.
Initial Balance Breakout Strategy
A strategy can monitor price moving beyond the Initial Balance.
Rather than trading the first tick outside the IB, rules can require:
- A completed break.
- Continued activity outside the range.
- Price structure supporting the direction.
- A predefined invalidation point.
Initial Balance Breaks Do Not Guarantee Trend Days
A market can break one side of the Initial Balance and subsequently return inside it or extend through the opposite side.
The breakout is one component of the developing auction rather than proof of a Trend Day.
Trading the Open: Strategies Based on Initial Balance
The Initial Balance is not fully known until its specified period has finished.
With a traditional first-hour IB, traders can use the opening periods to observe:
- Opening location relative to prior value.
- Early range width.
- Directional conviction.
- Whether price remains near or quickly leaves previous profile references.
Combining Market Profile with Other Technical Analysis Tools
Market Profile can be combined with price structure, moving averages, momentum tools, or fundamental analysis.
Additional indicators do not automatically increase signal accuracy.
The strongest reason to add another tool is that it answers a question not already answered by the profile.
Market Profile and Price Action
Price action can provide direct evidence around VAH, VAL, POC, IB boundaries, or single-print areas.
Useful observations include:
- Breakout and follow-through.
- Failed breakout.
- Higher lows.
- Lower highs.
- Repeated rejection.
7. Advantages and Limitations of Using Market Profile
Benefits of Using Market Profile in Forex Trading
Objective Session References
Once the session, TPO size, and Value Area calculation are defined, Market Profile produces repeatable reference levels.
Distinguishes Time-Based Acceptance From Brief Visits
TPO distributions show where a session spent more or less time.
This information is not as immediately visible on a conventional candlestick chart.
Useful for Both Balance and Directional Analysis
Profile structure can help describe whether a session is rotating around a developed area or extending directionally away from it.
Clear Historical Context
Previous Value Areas, POCs, Initial Balance levels, and profile extremes can provide consistent reference points for comparing sessions.
Common Challenges and How to Overcome Them
TPO and Volume Are Easily Confused
A traditional Market Profile POC is based on TPO count.
A Volume Profile POC is based on traded volume.
Mixing the two can materially change the analysis.
Spot Forex Volume Is Fragmented
The global spot Forex market is OTC and fragmented.
A broker's volume, tick count, or visible order flow is not a complete record of worldwide FX trading.
Session Definition Is Subjective in Forex
Futures contracts have defined exchange sessions. Spot Forex has no single global daily exchange close.
Two Forex traders using different session boundaries can therefore calculate different profiles.
Profile Levels Can Fail
VAH, VAL, POC, IB boundaries, single prints, and excess are descriptive references.
Price can move directly through any of them.
Developing Profiles Change
Today's Value Area and POC can move as additional TPOs are added during the session.
A developing POC should not be treated as fixed until the profile period is complete.
Interpretation Can Become Discretionary
Traders can introduce hindsight by changing:
- Session definitions.
- TPO sizes.
- Profile periods.
- Day-type interpretations.
- Which historical levels are considered important.
These settings should be defined before testing.
8. Practical Examples and Case Studies
Analyzing Real-World Market Profile Charts
The following examples are hypothetical and demonstrate the decision process rather than guaranteed Market Profile outcomes.
Example 1: Previous Value Area Rejection
Assume the previous EUR/USD profile has:
- VAH at 1.1050.
- TPO POC at 1.1015.
- VAL at 1.0980.
EUR/USD opens below VAH and later trades above 1.1050.
Instead of remaining above the previous Value Area, price closes back below VAH and subsequently forms a lower high.
A trader can use the failed acceptance above VAH as part of a bearish setup.
POC may be considered a reference target, but the strategy should not assume price is required to reach 1.1015.
Example 2: Initial Balance Breakout Failure
GBP/USD establishes a first-hour Initial Balance between 1.2700 and 1.2740.
Price later trades above 1.2740 but quickly returns inside the Initial Balance.
A trader waiting for sustained acceptance outside the IB avoids treating the first breakout as a complete trend signal.
Example 3: Developing Trend Day
USD/JPY establishes a relatively narrow Initial Balance and subsequently produces repeated upward range extension.
Pullbacks remain shallow and the profile becomes increasingly elongated.
These features can support a developing Trend Day hypothesis.
The trader still uses price invalidation rather than assuming the day must continue trending until the close.
Example 4: Single Print Revisit
EUR/JPY creates an interior single-print area during a rapid upward move.
Several sessions later, price returns to that region.
Rather than buying automatically at the first single-print price, the trader monitors how the new auction behaves within the area.
Price can reject the zone, partially trade through it, or completely fill the previous thin TPO structure.
Case Studies: Successful and Unsuccessful Trades
Valid Winning Trade
A trade follows the predefined setup, respects the risk limit, and reaches the planned target.
This supports the strategy sample without proving that the same profile pattern will work next time.
Valid Losing Trade
A setup can meet every Market Profile condition and still reach its stop.
The loss does not automatically mean that VAH, VAL, or POC was calculated incorrectly.
Process Error
A trader can also lose because the trading process changed, such as entering before confirmation, using an oversized position, or moving the stop.
Strategy losses and execution errors should be recorded separately.
9. Tips for Implementing Market Profile in Your Trading Plan
Setting Up Market Profile Charts
A Forex Market Profile template should document:
- Currency pair.
- Session start and end.
- TPO bracket duration.
- Price increment per TPO row.
- Value Area percentage.
- Whether POC is TPO based or volume based.
- Initial Balance duration.
Keep TPO and Volume Profiles Labeled Separately
When both are displayed, use clear terminology such as:
- TPO POC.
- TPO VAH and VAL.
- VPOC.
- Volume VAH and VAL.
This prevents different calculations from being treated as though they measure the same thing.
Risk Management and Position Sizing
Market Profile should identify a trading location before position size is calculated.
A structured sequence is:
- Identify the setup.
- Define the entry.
- Define structural invalidation.
- Measure the stop distance.
- Select acceptable monetary risk.
- Calculate position size.
No Universal 1:2 Risk-Reward Requirement
A 1:2 risk-to-reward ratio is a common educational example rather than a universal requirement.
Strategy expectancy depends on:
- Win rate.
- Average winner.
- Average loser.
- Spread.
- Commission.
- Slippage.
No Universal 1% to 2% Risk Rule
Risking 1% or 2% of equity per trade is also an example rather than a requirement.
Appropriate exposure depends on strategy drawdown, leverage, frequency, correlated positions, and the trader's account-level risk limits.
Standard Stops Can Slip
A stop-loss order does not guarantee execution at the requested stop price.
Rapid Forex movement and reduced liquidity can produce slippage, so realized loss can exceed the amount calculated from the intended stop.
Developing a Market Profile-Based Trading Routine
A repeatable routine can include:
- Mark previous profile references.
- Review scheduled economic events.
- Observe the current opening location.
- Measure the developing Initial Balance.
- Track developing value and POC without assuming they are fixed.
- Wait for a defined setup.
- Record entry, invalidation, size, and outcome.
Journal Profile Conditions
A Market Profile journal can record:
- Opening location relative to prior value.
- Initial Balance width.
- Range extension.
- TPO POC migration.
- Value Area movement.
- Single prints.
- Final day type.
- Whether the strategy rules were followed.
10. Advanced Market Profile Concepts (Optional)
Market Profile and Order Flow Analysis
Market Profile and order flow answer different questions.
TPO Market Profile describes where price traded during successive time intervals.
Order-flow tools can provide information about executed transactions or displayed resting liquidity when the underlying market data supports those measurements.
Spot Forex Order Flow Has Important Limits
A retail Forex order book does not display every global FX order.
Spot Forex liquidity is fragmented across dealers, platforms, and private liquidity pools. A Depth of Market feed therefore represents only the relevant broker, venue, or liquidity source.
Similarly, a broker's transaction data should not be described as the complete order flow of EUR/USD worldwide.
Integrating Market Profile with Volume Profile
Volume Profile shows how much recorded volume traded at individual prices.
Market Profile shows how many defined time brackets traded at those prices.
Comparing the two can reveal situations where:
- Both time and volume are concentrated around a similar price.
- High TPO concentration occurs at a different level from VPOC.
- Price spent little time in an area despite substantial recorded volume.
Agreement Does Not Guarantee a Trade
TPO POC and VPOC occurring at a similar price does not establish that the level will hold.
It simply shows that two different historical measurements concentrated around a similar area.
Using Market Profile in Different Market Conditions
Balanced Conditions
Rotational trade around an established Value Area can support a mean-reversion hypothesis.
The strategy should stop assuming balance once price begins establishing sustained activity away from the area.
Trending Conditions
Directional range extension and limited overlap between successive TPO periods can support a trend hypothesis.
Fading VAH or VAL mechanically during these conditions can place the trader against the developing move.
High-Volatility Conditions
Major economic events can move Forex prices rapidly across previous profile references.
Wider spreads and slippage can also make historical support and resistance less useful for precise execution.
Composite Profiles
Several sessions can be combined into a larger composite TPO or Volume Profile.
Composite profiles can provide broader context, although changing the start and end dates changes the resulting distribution.
The profile period should therefore be selected according to a predefined methodology rather than chosen because it produces an attractive historical shape.
Developing Versus Completed Profiles
A developing profile changes as each new TPO period is added.
The developing:
- POC can migrate.
- VAH can expand or shift.
- VAL can expand or shift.
- Final day type can change.
Backtests need to use the values that were actually available at the time rather than final session levels that were only known later.
11. Conclusion and Final Thoughts
Market Profile provides a structured way to analyze the relationship between price and time within a defined trading session. Traditional profiles are constructed from Time Price Opportunities, with each TPO showing that a price traded during a specified time bracket.
The most important technical distinction is between TPO Market Profile and Volume Profile. Traditional TPO POC is the price with the greatest TPO count, while VPOC is the price with the greatest recorded transaction volume. Traditional TPO Value Area contains approximately 70% of TPOs, while a volume-based Value Area uses recorded volume.
This distinction is especially important in Forex. The global spot FX market is decentralized, fragmented, and primarily OTC. Price and time can be profiled from a selected Forex feed, while broker or venue volume should not be presented as complete global transaction volume.
Auction Market Theory also requires careful language. Every completed transaction has both a buyer and seller, so price movement should not simply be explained as there being more buyers than sellers. The auction framework is more useful for studying how price moves between areas of greater and lesser trading activity.
Value Area, POC, Initial Balance, single prints, excess, and profile day types are descriptive tools. They do not guarantee support, resistance, mean reversion, breakouts, or trend continuation.
A complete Market Profile trading strategy should define the session, TPO settings, profile calculation, entry trigger, invalidation, position size, trading costs, and exit rules before results are evaluated.
Traders should also distinguish completed profile information from developing data. Using final POC, Value Area, or day-type information in a historical backtest before those values were available creates look-ahead bias.
The strongest use of Market Profile is therefore not to predict the market from one profile shape. It is to organize the auction consistently, identify measurable areas of interest, observe what price does around them, and evaluate the complete trading rules across a meaningful sample.
12. FAQs and Troubleshooting Common Issues
Common Questions About Market Profile
What is Market Profile?
Market Profile is a charting framework that organizes a trading session by price and time. Traditional profiles use TPOs to show which prices were visited during each defined time bracket.
What does TPO mean?
TPO means Time Price Opportunity. One TPO indicates that a particular price traded during one selected profile subperiod.
Is Market Profile based on volume?
Traditional TPO Market Profile is based on time at price rather than transaction volume.
Volume Profile is a separate methodology. Some charting platforms allow volume-based calculations to be displayed alongside a TPO profile.
What is the Point of Control?
In a traditional TPO profile, POC is the price with the highest number of TPOs.
In a Volume Profile, VPOC is the price with the highest recorded volume.
What is the Market Profile Value Area?
The traditional TPO Value Area contains approximately 70% of the session's TPOs and is bounded by VAH and VAL.
Does the 70% Value Area mean price has a 70% probability of staying there?
No. The 70% figure describes the portion of historical TPO observations included in the calculated area. It is not a forecast probability for the next price move.
What is the Initial Balance?
Traditionally, Initial Balance is the range of the first two profile periods. With 30-minute TPO periods, this normally means the first hour.
Does a narrow Initial Balance guarantee a breakout?
No. A narrow IB can leave more room for later range extension, but price can remain narrow for the complete session.
Is POC a magnet for price?
Not as a guaranteed rule. Price can revisit a POC, while strong directional auctions can move away without returning during the relevant period.
Are VAH and VAL reliable support and resistance?
They are technical reference levels rather than guaranteed barriers. Price can reject, consolidate around, or move directly through either boundary.
What are single prints?
Single prints are areas containing only one TPO at particular price levels within a profile structure. They represent limited time spent at those prices, not necessarily low transaction volume.
Do single prints always get filled?
No. A market can revisit and fill them, partially trade into them, or leave them untouched.
What is excess?
Excess generally refers to a tail of single TPOs at a profile extreme and is interpreted within Auction Market Theory as time-based evidence of rejection.
What is the best time frame for Market Profile analysis?
There is no universally best timeframe or profile period. Day traders often use session profiles, while swing traders can study daily, weekly, or composite structures.
The settings should match the strategy and remain consistent during testing.
Can Market Profile be used in Forex?
Yes. A TPO profile can be built from Forex price and time data.
The trader should define the session clearly and recognize that spot Forex volume and order-flow data are fragmented rather than globally centralized.
How do I know if a Market Profile breakout is genuine?
No single profile measurement can guarantee a genuine breakout.
A strategy can evaluate follow-through, continued activity outside the prior area, price structure, volatility, and actual execution conditions.
Is Market Profile suitable for beginners?
Beginners can learn Market Profile, although it is important to understand the difference between TPO, volume, Value Area, POC, and developing profile data before attempting more complex auction interpretations.
Solutions to Common Problems in Market Profile Trading
My POC Does Not Match Another Platform
Check whether each platform is calculating:
- TPO POC or VPOC.
- The same session.
- The same TPO price increment.
- The same profile period.
My Value Area Is Different
Confirm whether the platform is using a TPO-based or volume-based Value Area and whether both charts use the same session and percentage setting.
My Developing POC Keeps Moving
That is normal. New TPOs can change which price has the highest count before the profile is complete.
Forex Volume Profiles Differ Between Brokers
Different Forex brokers can receive different liquidity and activity. Their feeds do not represent one centralized global FX tape, so volume-based profiles can differ.
My Backtest Looks Much Better Than Live Trading
Check whether the historical test accidentally used final Value Area, POC, or day-type information before the session was complete.
Also include spread, commission, slippage, financing, and realistic execution assumptions.
Add a comment
Leave your thoughts