
Gann Theory: Forecasting Price Movements Using Time and Angle
Time to read: 22 minutes
Learn Gann Theory to forecast forex price movements using time cycles and Gann Angles, and master strategies for precise market analysis and smarter trading decisions.
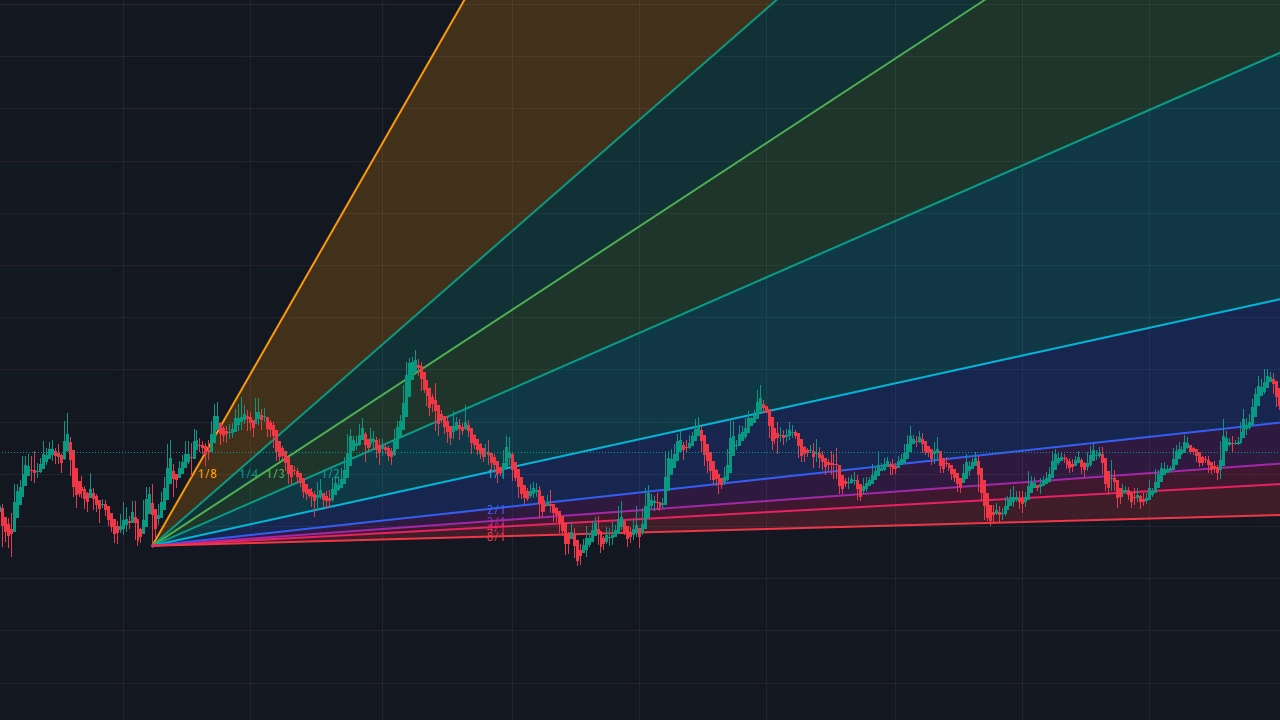
Gann Theory in Forex trading refers to a group of technical analysis methods associated with W.D. Gann, including Gann Angles, the Gann Fan, time cycles, price-time relationships, and geometric tools such as the Square of Nine.
Gann's work combined chart analysis with his own ideas about mathematics, geometry, cycles, and what he described as natural laws. These ideas should be separated from established statistical facts. A Gann angle, time cycle, or Square of Nine level does not prove that a currency pair will reverse or reach a particular price.
The most practical way to study Gann methods is to treat them as testable technical frameworks. That means defining the chart scale, anchor points, price-time ratios, entry rules, invalidation, position size, and execution assumptions before evaluating historical results.
1. Introduction to Gann Theory
Who Was W.D. Gann?
William Delbert Gann was an American trader and market writer active during the first half of the twentieth century. His published work included market-analysis books, trading courses, annual forecasts, geometric charting methods, and studies of recurring market cycles.
Gann's methods remain available on modern trading platforms through tools such as:
- Gann Fans.
- Gann Lines.
- Gann Grids.
- Gann Squares.
What Is Gann Theory?
Gann Theory is not one standardized trading strategy.
The term generally covers several related ideas:
- Measuring rates of price change against time.
- Drawing geometric angles from important highs and lows.
- Studying recurring time intervals.
- Comparing price ranges with elapsed time.
- Using geometric or numerical structures such as the Square of Nine.
Gann's Own View of Forecasting
Gann wrote about geometry, mathematics, repetition, and cycles as foundations for forecasting.
He also described his work using concepts such as natural law and the repetition of history.
These statements are important for understanding the historical Gann framework, but they should not be presented as scientifically established laws governing Forex prices.
Gann Theory and Modern Forex Trading
Modern Forex traders can use Gann tools without accepting every philosophical or esoteric claim historically associated with Gann's work.
The practical question is whether a precisely defined Gann-based rule adds useful information when tested against:
- Real currency price data.
- Spread and commission.
- Slippage.
- Different volatility regimes.
- Out-of-sample data.
No Built-In Predictive Edge
The historical importance of Gann's work does not establish that Gann-based strategies have a universal forecasting advantage.
Performance depends on the exact implementation, particularly because Gann methods can contain discretionary choices involving scaling, anchor points, cycle selection, and price normalization.
2. Core Principles of Gann Theory
Price, Time, and Range Relationship
One of the central ideas associated with Gann is that price movement can be compared with elapsed time.
Instead of looking only at whether EUR/USD rises 100 pips, a Gann analysis can also ask how long that movement took and how its rate of change compares with a predefined price-time ratio.
Price and Time Need a Common Scale
Price and time use different units.
Forex price might be measured in pips, while time might be measured in bars, hours, or days.
A trader therefore needs a conversion rule such as:
10 pips per daily bar
or:
5 pips per hourly bar
Changing that conversion changes the resulting Gann angles.
Avoid Mechanical Time-Equals-Price Rules
A market rising for 90 days does not become statistically due for a reversal simply because 90 days have passed.
Likewise, a fast price move does not prove that a corrective move must follow.
These relationships can be incorporated into a trading hypothesis, but they require testing rather than assumption.
The Concept of Natural Law in Trading
Gann frequently described markets through ideas involving cycles, mathematics, geometry, repetition, and natural law.
These concepts belong to Gann's historical analytical philosophy.
Modern traders should distinguish between:
- Documented Gann methodology: Angles, price-time ratios, cycles, and geometric calculations.
- Gann's interpretation: His belief that recurring laws or cycles govern future events.
- Empirical evidence: Whether a precisely defined modern strategy actually performs after costs.
Do Not Automatically Mix Gann and Fibonacci
Fibonacci retracements and Gann analysis are distinct technical-analysis frameworks.
Traders can combine them, but the golden ratio should not be presented as a defining foundation of every Gann method simply because both approaches involve numerical relationships.
Repetition Is a Hypothesis, Not a Guarantee
Historical market patterns can recur while remaining affected by different economic, monetary, liquidity, and positioning conditions.
A previous 60-day or 90-day pattern therefore does not establish what the next comparable period will do.
3. Understanding the Gann Angles
What Are Gann Angles?
Gann Angles are diagonal lines designed to represent predefined relationships between units of price movement and units of time.
A Gann Fan normally includes several ratios around a central 1x1 relationship.
The 1x1 line represents:
One selected unit of price movement for one selected unit of time
The 1x1 Is Not Automatically a 45-Degree Market Relationship
The 1x1 line is commonly called the 45-degree Gann angle.
This is correct only after the chart is calibrated so that one chosen unit of price occupies the same visual scale as one chosen unit of time.
Changing the price-axis scale, chart aspect ratio, or pips-per-bar setting can change the visual slope.
This makes chart scaling one of the most important parts of Gann-angle analysis.
Why Scale Matters in Forex
Suppose one trader defines one price unit as 10 pips per daily bar while another uses 25 pips per daily bar.
Both can start from the same EUR/USD low and obtain different fan levels.
The angle therefore does not exist independently of the selected price-time calibration.
Constructing Gann Angles on Price Charts
A reproducible process can follow these steps:
- Select the market and timeframe.
- Define the price unit.
- Define the time unit.
- Lock or document the chart scale.
- Select the significant high or low used as the anchor.
- Draw the fan using the same settings throughout the test.
Anchor Selection Is a Source of Discretion
Different swing highs and lows can generate different Gann Fans.
A strategy should therefore define what qualifies as an anchor before evaluating the trade outcome.
Choosing the starting point after seeing which fan best fits historical price introduces hindsight bias.
The Significance of Different Angles (1x1, 2x1, 1x2, etc.)
Gann Fans use ratios such as:
- 1x8.
- 1x4.
- 1x3.
- 1x2.
- 1x1.
- 2x1.
- 3x1.
- 4x1.
- 8x1.
These ratios describe different rates between price and time.
Platform Conventions Can Differ
The labeling of price-to-time ratios is not presented identically by every charting platform or educational source.
For example, documentation can differ in whether the first number in a ratio is described as price or time.
Traders should therefore use the definitions supplied by the specific platform rather than assuming that every 2x1 or 1x2 label is implemented identically.
Angles as Technical References
Traditional Gann analysis treats ascending angles as possible support references and descending angles as possible resistance references.
Price moving above or below an angle provides information about its position relative to that particular geometric framework.
It does not prove that the broader Forex trend has changed.
Do Not Continuously Move a Fan to Fit Price
Once a fan is part of an active setup, moving its anchor or scale because price no longer respects the original angles destroys the original test.
A new fan can be drawn from a later qualifying pivot when the strategy explicitly allows it, while the previous analysis should remain recorded.
4. The Importance of Time Cycles
Definition and Role of Time Cycles in Gann Theory
Time-cycle analysis attempts to identify recurring intervals between important market events such as highs, lows, breakouts, or volatility changes.
Gann placed substantial emphasis on the recurrence of historical cycles.
Time Cycle Example
Assume a trader identifies several major EUR/USD swing highs separated by approximately 60 trading days.
A later 60-day interval can be marked as a future time window of interest.
The correct interpretation is not that EUR/USD must reverse on day 60.
Instead, the trader can monitor whether independent price evidence develops around that period.
How to Identify Key Time Cycles
A systematic process can include:
- Define what qualifies as a major swing.
- Measure intervals between historical qualifying swings.
- Record the complete distribution rather than only visually similar examples.
- Test whether particular intervals occur more consistently than chance or flexible hindsight selection would suggest.
- Evaluate the rule on new data.
Avoid Arbitrary Cycle Selection
Numbers such as 30, 60, 90, 180, or 365 days are commonly discussed in cycle analysis.
Their popularity does not establish that every market has a reliable turning point at those intervals.
A trader should not keep trying different cycle lengths until one appears to explain a completed chart.
The Relationship Between Time and Price Movements
Price-time analysis can compare:
- The size of a move.
- Its duration.
- The rate of change.
- Previous moves of similar duration.
These measurements can provide structure without establishing that price and time must eventually become equal.
Economic Events Can Override Historical Rhythm
Forex markets react to central bank decisions, inflation data, employment releases, political developments, intervention, liquidity changes, and shifts in interest-rate expectations.
A historical cycle should therefore be treated as one analytical input rather than a rule capable of overriding new information.
5. Gann’s Price and Time Squaring
Explanation of Squaring Price and Time
Price-time squaring is a Gann concept that attempts to relate numerical price movement with elapsed time through a chosen scale or geometric framework.
The term should not be interpreted as a universal equation stating that a specific number of pips must equal the same number of days.
The relationship depends on how price has been normalized and which Gann method is being applied.
A Simplified Price-Time Framework
Consider a Gann strategy that defines:
1 time unit = one daily bar
and:
1 price unit = 10 pips
A 40-unit time interval therefore represents 40 days, while a 40-unit price movement represents 400 pips.
This creates a consistent comparison within the strategy. It does not establish that a 400-pip move must reverse after 40 days.
Techniques for Calculating Price-Time Square Levels
Gann literature includes several geometric and numerical tools for relating price and time, including methods commonly described as:
- Square of Nine.
- Gann Squares.
- Circle or 360-degree calculations.
- Other numbered grids and master charts.
These Methods Are Not Fully Standardized
Modern descriptions of advanced Gann calculations can differ substantially in their formulas, normalization, starting values, and interpretation.
A trader should record the exact calculation being used instead of referring only to a general term such as Square of Nine strategy.
Do Not Treat Geometric Alignment as Confirmation
A price reaching a calculated price-time level means that the market reached a level specified by the model.
It does not independently confirm a reversal.
The strategy still needs observable market behavior and a defined invalidation rule.
6. The Gann Fan: An Analytical Tool
Introduction to the Gann Fan
The Gann Fan is a collection of diagonal price-time lines extending from a selected chart anchor.
Modern charting platforms generally provide the fan as a drawing tool, allowing the trader to specify an anchor and scale rather than calculating every line manually.
How to Build a Reproducible Gann Fan
- Select a qualifying major high or low.
- Record the exact price and timestamp.
- Define the pips-per-bar or equivalent scale.
- Lock the price-to-time scale where required.
- Apply the same fan settings across the test sample.
How to Use the Gann Fan for Forecasting
A more neutral description is to use the fan for scenario analysis rather than deterministic forecasting.
An ascending fan can create several technical scenarios:
- Price remains above the selected angle.
- Price tests the angle and rejects it.
- Price closes through the angle.
- Price moves toward another angle in the fan.
The strategy then defines what each scenario means before the outcome is known.
Angle Breaks Need Price Confirmation
Traditional Gann interpretation can treat a break of an angle as evidence that the prior rate of price change has weakened.
That is different from saying the entire trend has reversed.
Price structure can provide additional evidence through:
- Lower highs after an upside trend.
- Higher lows after a downside trend.
- Breaks of horizontal support or resistance.
- Failed retests.
Practical Examples of Gann Fan in Action
Example 1: Ascending Fan Support
Assume EUR/USD forms a major swing low and a correctly scaled ascending Gann Fan is drawn from that point.
Price later pulls back toward the strategy's selected 1x1 line.
Rather than buying solely because the line was touched, the trader waits for EUR/USD to stop making lower lows and establish a short-term bullish structure.
The angle identifies the area being monitored. Actual price behavior triggers the trade.
Example 2: Fan Break
GBP/USD remains above an ascending Gann angle for several sessions and later closes beneath it.
The break shows that price is no longer maintaining the rate represented by that angle.
The trader does not assume an immediate bearish reversal. A further break of market structure is required by the strategy.
Multiple Timeframes
Gann Fans can be applied to different timeframes, but changing the timeframe changes the time unit and potentially the required scale.
A daily Gann Fan and a one-hour Gann Fan should therefore be treated as separate measurements rather than automatically expected to produce the same levels.
7. Key Gann Trading Strategies
Using Gann Theory for Entry and Exit Points
A complete Gann trading strategy needs more than an angle or cycle.
It should define:
- Market and timeframe.
- Anchor-selection rule.
- Chart scale.
- Gann level or cycle condition.
- Entry trigger.
- Invalidation.
- Position size.
- Exit condition.
Gann Angle Trend Strategy
A simple trend framework can monitor whether price is maintaining position relative to an ascending or descending Gann angle.
For a bullish setup, the trader can require:
- Price above the selected ascending angle.
- Bullish conventional market structure.
- A pullback toward the angle.
- A bullish entry trigger.
Gann Break Strategy
Another approach monitors a break of a previously respected Gann line.
A line break can indicate that the previous rate of change has failed.
The strategy can then require horizontal structure or follow-through before entering in the opposite direction.
Time-Window Strategy
A Gann time-cycle strategy can identify a future period where a reversal or acceleration will be monitored.
No trade is entered simply because the date arrives.
The time cycle establishes a window, while price supplies the actual trigger.
Combining Gann Angles with Other Technical Indicators
Gann tools can be combined with other forms of analysis, but additional indicators should have a specific purpose.
Gann and Moving Averages
Moving averages can provide a separate trend calculation.
Agreement between an average and a Gann angle can create alignment without guaranteeing continuation.
Gann and RSI
RSI can provide momentum information.
An RSI reading below 30 around a Gann support reference should not automatically be labeled a strong buy signal because RSI can remain depressed during a strong decline.
Gann and Fibonacci
A Fibonacci retracement overlapping a Gann line creates two technical references in the same region.
The overlap does not establish a known probability of reversal.
Gann and Bollinger Bands
Bollinger Bands can provide information about relative price and volatility.
An outer-band touch at a Gann angle remains an analytical condition rather than automatic confirmation.
Risk Management and Trade Setup Techniques
Gann-based conviction should not determine position size.
A structured sequence is:
- Define entry.
- Define structural invalidation.
- Measure stop distance.
- Choose acceptable monetary risk.
- Calculate position size.
No Universal 1% to 2% Rule
Risking 1% or 2% per trade is a common educational example rather than a universal requirement.
Appropriate exposure depends on trade frequency, drawdown, leverage, correlation, strategy characteristics, and account-level risk limits.
Stop Orders Can Slip
Standard stop-loss orders can execute beyond the intended stop price during fast markets.
A Gann level should therefore not be treated as an absolute maximum-loss boundary.
8. Common Mistakes When Using Gann Theory
Misinterpretation of Angles and Time Cycles
The most serious technical error is drawing Gann angles without defining the chart scale.
A visually attractive 45-degree line has no consistent price-time meaning unless the relationship between the axes is calibrated.
Assuming 1x1 Always Means 45 Degrees on Screen
Chart zoom and axis scaling can change the visual slope.
The 45-degree interpretation applies to a properly scaled 1:1 price-time relationship, not simply any diagonal line drawn at a visually convenient angle.
Mixing Platform Conventions
Traders should not copy 2x1 and 1x2 interpretations from one platform into another without checking how the software defines its ratios.
Changing Anchors After the Outcome
Repositioning a fan until historical price appears to respect it creates hindsight bias.
The anchor rule should be defined before the signal is evaluated.
Treating Time Cycles as Deadlines
A 90-day cycle is not a promise that the market will reverse on day 90.
Cycle dates are better treated as observation windows.
Overcomplicating the Analysis Process
Combining several fans, Square of Nine calculations, multiple cycles, Fibonacci levels, astrology-based interpretations, oscillators, and moving averages can create enough flexibility to explain almost any completed chart.
A more testable strategy uses a small number of clearly defined rules.
Confusing Complexity With Accuracy
A complicated calculation is not automatically more predictive than a simple one.
Accuracy needs to be demonstrated through testing rather than inferred from mathematical appearance.
Ignoring Transaction Costs
Historical technical levels can appear precise on a chart while actual Forex execution includes:
- Spread.
- Commission.
- Slippage.
- Overnight financing where applicable.
Overfitting Gann Parameters
Selecting one exact scale, cycle, anchor rule, and confirmation combination because it produced ideal historical trades can create an overfit system.
Parameters should be evaluated on unseen data before being trusted.
Tips to Avoid Common Pitfalls
- Record the pips-per-bar scale.
- Define anchors objectively.
- Use completed historical data without hindsight adjustment.
- Track failed levels as well as successful ones.
- Include realistic trading costs.
- Keep risk separate from confidence in the forecast.
9. Practical Examples and Case Studies
Historical Examples of Gann Theory in Action
Claims about Gann's historical forecasting record should be presented carefully.
In his 1930 book Wall Street Stock Selector, Gann reproduced what he described as his 1929 Annual Stock Forecast and stated that it had anticipated major parts of the year's market decline.
That is useful evidence of what Gann himself claimed and published. It should not be converted into a general statement that his methods were proven to forecast crashes with remarkable accuracy.
Historical performance claims require independently verifiable records, complete forecasts, publication dates, failed calls, trading rules, and transaction assumptions before a meaningful success rate can be calculated.
Hypothetical Forex Example: Gann Fan Pullback
EUR/USD establishes a significant swing low.
A trader applies a Gann Fan using a documented price-time scale.
Price remains above the selected ascending angle and later pulls back toward it.
Instead of entering on the angle alone, the trader requires:
- A higher low.
- A break of short-term resistance.
- A predefined stop beneath structural invalidation.
The Gann line defines the location, while price action defines the trade.
Hypothetical Forex Example: Time Cycle Failure
GBP/USD has formed three previous swing highs roughly 60 trading days apart.
The trader marks the next 60-day window as a potential turning period.
GBP/USD reaches the date but continues trending without a reversal signal.
No trade is entered.
This demonstrates the correct treatment of a cycle as a hypothesis rather than a scheduled market reversal.
Hypothetical Forex Example: Angle Break
USD/JPY maintains a rising rate of change above an ascending Gann angle.
Price later closes below the angle.
The trader waits for a lower high and a break of horizontal support before considering a short position.
The angle break alone is not treated as proof of a bearish trend.
Analyzing Forex Charts Using Gann Techniques
A repeatable workflow can be:
- Identify the market and timeframe.
- Define a qualifying pivot.
- Set the scale.
- Apply the chosen Gann tool.
- Mark any predefined time windows.
- Wait for objective price behavior.
- Define invalidation.
- Calculate position size.
- Record the result without moving the original analysis.
10. Tools and Software for Gann Analysis
Recommended Software for Drawing Gann Angles
Modern platforms can automate the geometry involved in Gann charting.
TradingView
TradingView provides Gann Fan and Gann Square drawing tools and includes controls related to chart scaling.
MetaTrader
MetaTrader includes Gann Line, Gann Fan, and Gann Grid tools.
MetaTrader's Gann tools include a Pips Per Bar parameter, which directly illustrates why the relationship between price and time must be calibrated.
NinjaTrader
NinjaTrader also supports Gann Fan drawing objects and exposes a points-per-bar setting for its implementation.
Using Charting Platforms Effectively
The software should help reproduce the methodology rather than determine the methodology.
Before using a Gann tool, record:
- Anchor point.
- Timeframe.
- Price scale.
- Pips or points per bar.
- Fan direction.
- Which angle ratios are enabled.
Lock the Scale Where Necessary
Automatic chart resizing can change the visual relationship between price and time.
Use the platform's appropriate scale or pips-per-bar controls when the strategy depends on geometric angle interpretation.
How Technology Has Evolved Gann Analysis
Modern software has made Gann analysis faster and more reproducible.
It can:
- Draw fans automatically.
- Preserve templates.
- Calculate price-time grids.
- Test coded rules.
- Compare several markets efficiently.
Technology does not make the underlying forecast more accurate simply because the calculation is automated.
Automation Requires Explicit Rules
A computer cannot objectively backtest an instruction such as "draw the fan from the most important low" unless the strategy defines exactly how that low is identified.
Turning discretionary Gann analysis into code can therefore expose assumptions that are easy to overlook during manual chart analysis.
11. Advanced Gann Techniques and Studies
Master Charts and Square of Nine
The Square of Nine is one of the best-known tools associated with advanced Gann analysis.
Modern implementations generally organize numbers through a geometric or spiral structure and relate price levels through angular or numerical relationships.
There are several different modern interpretations of how the Square of Nine should be applied.
Define the Exact Square of Nine Method
A testable strategy should specify:
- Starting value.
- Price normalization.
- Angular increment.
- Direction of calculation.
- Which resulting levels are tradable.
Without these definitions, the term Square of Nine signal is too broad to evaluate objectively.
The Hexagon Chart and Circle of 360
Gann-related literature also includes geometric tools commonly described as the Hexagon Chart and 360-degree calculations.
These methods attempt to organize time and price through geometric relationships.
They should not be described as capable of forecasting market turning points with remarkable accuracy unless a specific rule set has demonstrated that performance on independent data.
Deeper Dive into Gann’s Forecasting Methods
Advanced Gann study often moves beyond ordinary chart angles into combinations of:
- Time cycles.
- Price cycles.
- Geometric ratios.
- Number grids.
- Historical recurrence.
Separate Historical Interpretation From Testable Strategy Rules
Some parts of Gann's writings are open to multiple interpretations.
This creates a risk that traders explain successful historical outcomes using one interpretation while disregarding examples where the same rule failed.
A modern research process should convert any Gann idea into an explicit rule before measuring performance.
Out-of-Sample Testing
Part of the data should be excluded while the strategy is being developed.
Once parameters such as scale, cycle length, anchor rules, and entries are fixed, the system can be evaluated on unseen data.
Walk-Forward Testing
Walk-forward analysis can evaluate whether a Gann-based rule remains useful as market conditions change.
This is particularly important for methods that depend on selected cycle lengths or price-time scaling.
Avoid Look-Ahead Bias
Historical swing highs and lows often look obvious after the complete chart is visible.
A backtest must ensure that the pivot used to anchor a Gann Fan could actually have been identified at the time.
Complexity Does Not Establish an Edge
Mathematical symmetry, geometry, or elegant numerical relationships can make a market model visually compelling.
The trading value still depends on measurable performance after risk and transaction costs.
12. Conclusion and Practical Takeaways
Gann Theory is a broad technical-analysis framework associated with W.D. Gann's study of price, time, geometry, cycles, and recurring market behavior. Its best-known tools include Gann Angles, the Gann Fan, price-time squaring, and numerical methods such as the Square of Nine.
The most important practical issue is chart scaling. A 1x1 Gann line represents one selected unit of price per one selected unit of time. It appears as a 45-degree line only when the chart has been calibrated to the appropriate 1:1 scale. Changing the pips-per-bar relationship changes the resulting fan.
Ratio labels such as 2x1 and 1x2 also need careful interpretation because charting platforms and educational sources can use different conventions. Traders should follow the exact implementation documented by the platform being tested.
Gann's ideas about cycles and natural law should be understood as part of his historical framework rather than as established scientific laws of Forex markets. A 60-day or 90-day interval does not force a reversal, and a geometric alignment does not guarantee support, resistance, or future direction.
Gann levels are therefore more useful as predefined areas or scenarios than as automatic forecasts. A trader can monitor what price actually does around an angle, cycle date, or calculated level and require independent entry and invalidation rules.
Historical claims about Gann's forecasting record also require care. Gann published and promoted forecasts that he said had anticipated major market movements, including his 1929 outlook. Such retrospective claims should not be converted into a universal accuracy rate without independently verifiable records and complete testing.
Modern charting software makes Gann tools easier to construct, but automation does not solve subjective choices involving anchors, scale, cycles, and interpretation. These rules must be defined before meaningful backtesting is possible.
The strongest modern approach to Gann Theory is evidence based: define the methodology precisely, preserve the original chart scale and anchor points, include failed signals, account for real Forex trading costs, control position size, and test the strategy on data that was not used to design it.
Add a comment
Leave your thoughts