
Renko and Heikin-Ashi Charts: Comprehensive Trading Guide
Time to read: 20 minutes
Discover how Renko and Heikin-Ashi charts simplify trend analysis and reduce noise, helping you make informed and confident trading decisions.
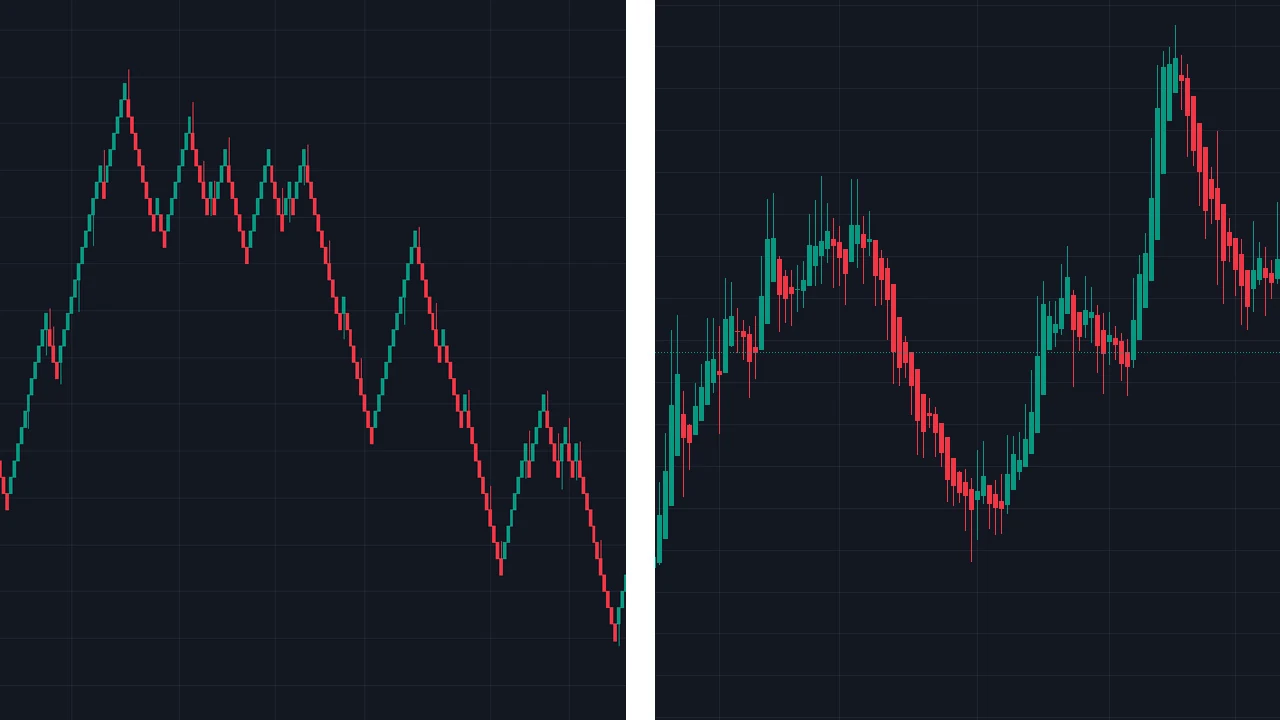
Renko and Heikin-Ashi charts are alternative charting methods designed to present price behavior differently from standard candlestick charts. Renko emphasizes price movement by constructing bricks after predefined price changes, while Heikin-Ashi averages price data to create smoother candles.
Both methods can make trends visually easier to follow, but that clarity comes from filtering or transforming market data. Renko bricks and Heikin-Ashi candles contain synthetic price values and should not automatically be treated as exact executable market prices.
This guide explains how Renko and Heikin-Ashi charts are calculated, how traders use them for trend, breakout, and reversal analysis, their limitations, and the precautions needed when backtesting or placing trades from non-standard charts.
Renko and Heikin-Ashi Charts: Comprehensive Trading Guide
Two Different Ways to Simplify Price Action
Renko and Heikin-Ashi both reduce some of the visual detail found on conventional candlestick charts, but they do so in fundamentally different ways.
- Renko: Creates new bricks after price moves by a defined amount.
- Heikin-Ashi: Creates one candle for each selected time period using averaged price values.
Neither chart type reveals future direction. They reorganize historical and current price data so that certain trend characteristics become easier to see.
Synthetic Prices Require Extra Care
A standard candlestick represents actual open, high, low, and close values for its period.
Renko bricks and Heikin-Ashi candles can display values that are calculated rather than actual tradable prices at that exact moment. This distinction matters when:
- Setting entry orders.
- Placing stop losses.
- Calculating slippage.
- Backtesting strategies.
1. Introduction to Alternative Charting Techniques
Why Traders Use Alternative Charts
Conventional candlestick charts show detailed price movement, which can be useful but can also make short-term fluctuations visually dominant.
Alternative chart types change how that information is displayed.
Traders commonly use them to study:
- Trend persistence.
- Reversals.
- Breakouts.
- Support and resistance.
- Changes in price momentum.
Filtering Noise Does Not Mean Removing False Signals
Smoothing or filtering a chart can reduce visible short-term fluctuations.
It does not remove market uncertainty or guarantee more accurate signals. A trend can still reverse after several Renko bricks in one direction, and a smooth Heikin-Ashi sequence can change quickly when actual price movement changes.
Use the Chart Type to Answer a Specific Question
Renko is particularly useful when the main question is how far price has moved.
Heikin-Ashi is more useful when the main question is how a time-based trend looks after price data has been smoothed.
Choosing between them should depend on the strategy rather than on which chart appears visually cleaner.
2. What are Renko Charts?
The Basics of Renko Chart Construction
Renko charts take their name from the Japanese word renga, meaning brick.
A traditional Renko chart uses a predefined brick size. A new brick appears when price moves far enough from the previous completed brick according to the platform's Renko construction rules.
Brick size can be defined through:
- A fixed price amount.
- A fixed number of pips.
- A percentage method.
- A volatility-based method such as ATR.
Traditional Brick Example
Assume EUR/USD uses a Renko brick size of 10 pips.
During an existing upward Renko sequence, another upward brick generally requires a further 10-pip movement in the same direction.
A reversal typically requires a larger opposing movement because price first needs to cross back through the preceding brick and then travel far enough to construct a brick in the opposite direction.
On TradingView's standard Renko implementation, for example, a directional reversal requires a movement of two brick sizes.
How Renko Charts Filter Market Noise
Price changes smaller than the required brick threshold do not create another completed traditional Renko brick.
This reduces the visual prominence of smaller fluctuations.
The effect depends heavily on brick size:
- Smaller bricks show more price detail and change direction more frequently.
- Larger bricks remove more movement and create fewer signals.
Brick Size Changes the Analysis
There is no universally correct Renko brick size.
Two traders using different box sizes can see materially different Renko structures from the same underlying EUR/USD price history.
The selected brick methodology should therefore be part of the formal trading strategy and remain consistent during testing.
Fixed Versus ATR-Based Renko
A fixed brick maintains the same price size until the trader changes it.
An ATR-based implementation uses Average True Range to define brick size according to measured volatility.
ATR-based bricks can adapt to volatility, but the method also changes the chart as volatility calculations change. Strategy testing should account for the exact platform implementation.
Time Considerations in Renko Charts
Renko is described as a price-based chart because a new brick is not required simply because another minute, hour, or day passes.
One brick might form quickly during a large market move, while another might take much longer.
However, saying Renko charts completely ignore time can be misleading on modern trading platforms.
Some platforms construct historical Renko bricks from underlying time-based bars when complete historical tick data is unavailable. The selected source timeframe can therefore change the historical brick sequence.
Projection Bricks and Recalculation
Some Renko platforms display projected bricks before the underlying source bar has closed.
These projected bricks can disappear or change before they become confirmed historical bricks.
Traders should distinguish a completed brick from a temporary real-time projection when defining entries.
Advantages of Using Renko Charts
- Price-focused structure: Brick creation is driven primarily by predefined price movement rather than a fixed display interval.
- Clear directional sequences: Consecutive bricks make directional movement visually easy to identify.
- Adjustable sensitivity: Brick size can be chosen according to the strategy.
- Useful structural references: Previous brick reversals and consolidations can help define areas for further analysis.
Limitations of Renko Charts
Synthetic Brick Prices
Renko brick open and close values are constructed values and may not represent the exact market prices available at a particular point in time.
Historical Construction Can Depend on Source Data
When complete tick history is unavailable, platforms can construct Renko history from time-based OHLC data. This means the chart can vary according to source interval and platform methodology.
Signals Can Be Delayed
Price must travel the required distance before a new brick forms. A larger brick size therefore removes more noise while also waiting for more price movement before showing a change.
Renko Is Not Inherently Unsuitable for Scalping
Renko is sometimes described as suitable only for swing or longer-term trading.
That is too absolute. Traders can use small brick sizes for short-term analysis, although execution speed, spreads, source-data precision, and projection-brick behavior become more important.
Backtesting Requires Special Care
Backtesting directly against synthetic Renko OHLC prices can produce unrealistic fills.
A more defensible test should use actual underlying market prices for execution while using Renko only to generate or filter signals.
3. Trading Strategies Using Renko Charts
Identifying Trends with Renko Charts
A sequence of upward bricks shows that price has repeatedly moved far enough to satisfy the selected upward brick threshold.
A sequence of downward bricks shows the opposite.
The number of same-direction bricks can describe trend persistence, but it does not provide a universal measurement of trend strength or probability of continuation.
Basic Trend-Following Framework
A Renko trend strategy can require:
- Several completed bricks in one direction.
- Alignment with broader price structure.
- A predefined entry condition.
- A real-market invalidation level.
- Position size calculated from the actual stop distance.
Support and Resistance Levels
Repeated Renko reversals around a similar area can provide a visual reference for support or resistance.
These areas are not guaranteed barriers.
Because Renko data is transformed, it is often useful to confirm the exact level on a conventional price chart before placing orders.
Common Renko-Based Trading Strategies
Trend Following
A trend-following strategy can remain aligned with the current brick direction until a predefined reversal condition develops.
A single opposing brick does not need to be treated as an automatic exit unless that is part of the tested strategy.
Breakout Trading
A trader can identify a consolidation in Renko structure and monitor for completed bricks outside the previous range.
A breakout brick provides evidence that price moved by the required amount beyond the selected threshold. It does not guarantee continuation.
Brick Reversal Strategy
Some traders use a confirmed change from upward bricks to downward bricks, or the reverse, as a reversal trigger.
The signal should be tested carefully because shorter brick sizes can produce frequent reversals during choppy conditions.
Moving Average Crossover
Moving averages can be applied to Renko values, but the resulting indicator is calculated from already transformed chart data.
A crossover can form part of a trading system without independently proving a trend change.
Combining Renko with Other Technical Indicators
Indicators such as RSI, MACD, or moving averages can be calculated on Renko charts where the platform supports them.
Their interpretation requires care because they are being calculated from synthetic brick values rather than conventional time-based closes.
Renko and RSI
RSI can describe momentum characteristics of the transformed Renko series.
Readings above 70 or below 30 should not be treated as automatic reversal signals.
Renko and MACD
MACD can provide another way to measure trend and momentum in the Renko series.
Both the Renko chart and MACD derive from price, so their agreement is not fully independent confirmation.
Use Actual Price for Execution
A strong practical workflow is to use Renko for signal generation and a conventional candlestick or execution chart for:
- Exact entry price.
- Bid-ask spread.
- Stop placement.
- Slippage analysis.
4. What are Heikin-Ashi Charts?
Understanding Heikin-Ashi Chart Construction
Heikin-Ashi is a modified candlestick method that creates averaged OHLC values from conventional price data.
Unlike a standard candle, the displayed Heikin-Ashi open and close are calculated values.
Heikin-Ashi Formula
The standard formulas are:
- Heikin-Ashi Close: (Current Open + Current High + Current Low + Current Close) / 4.
- Heikin-Ashi Open: (Previous Heikin-Ashi Open + Previous Heikin-Ashi Close) / 2.
- Heikin-Ashi High: Maximum of Current High, Current Heikin-Ashi Open, and Current Heikin-Ashi Close.
- Heikin-Ashi Low: Minimum of Current Low, Current Heikin-Ashi Open, and Current Heikin-Ashi Close.
Heikin-Ashi Uses Time-Based Bars
Unlike Renko, Heikin-Ashi normally preserves the selected time interval.
A one-hour Heikin-Ashi chart still produces one bar for each one-hour period. The difference is that its candle values are transformed from the underlying actual OHLC data.
How Heikin-Ashi Charts Smooth Price Action
Because the current Heikin-Ashi Open depends partly on the previous Heikin-Ashi candle and the close is an average of the current standard OHLC values, abrupt price changes can appear smoother than they do on a normal candlestick chart.
Smoothing can make a directional sequence visually clearer while also delaying some changes in appearance.
Difference Between Heikin-Ashi and Traditional Candlesticks
Standard candlesticks display the actual open, high, low, and close for the selected period.
Heikin-Ashi displays calculated values.
A trader should therefore not assume that a Heikin-Ashi closing price was actually available as an executable Forex quote.
Advantages of Using Heikin-Ashi Charts
- Smoother trend display: Consecutive directional candles can be easier to follow visually.
- Reduced visual noise: Averaging deemphasizes some individual price fluctuations.
- Clear trend transitions: Changes in candle structure can make shifts in the smoothed trend easier to monitor.
- Timeframe preservation: Heikin-Ashi keeps the selected bar interval while transforming its price representation.
Limitations of Heikin-Ashi Charts
Displayed Prices Are Synthetic
Heikin-Ashi open and close values are not the actual market open and close of the underlying period.
Smoothing Adds Delay
The same averaging that creates a cleaner trend can delay visual recognition of abrupt changes.
Exact Execution Requires Actual Prices
Entries, stops, and targets should be checked against real market prices rather than assumed executable Heikin-Ashi values.
Backtesting Can Be Misleading
A strategy engine that fills orders at synthetic Heikin-Ashi OHLC values can generate results that would not have been achievable in the real market.
Not Automatically Unsuitable for Short-Term Trading
Heikin-Ashi is sometimes described as inappropriate for scalping.
Short-term traders can use it, but the smoothing and synthetic prices make exact timing and execution especially important. Suitability depends on the complete strategy rather than the chart type alone.
5. Trading Strategies Using Heikin-Ashi Charts
Spotting Trends and Reversals with Heikin-Ashi
A sequence of bullish Heikin-Ashi candles with limited or absent lower shadows can accompany sustained upward movement.
A sequence of bearish candles with limited or absent upper shadows can accompany sustained downward movement.
These patterns describe the smoothed trend rather than guarantee that price will continue.
Trend Continuation Framework
A trader can define a continuation setup using:
- Several same-direction Heikin-Ashi candles.
- Broader trend structure on the conventional chart.
- A pullback or entry trigger.
- Actual price invalidation.
Reversal Warning
A smaller Heikin-Ashi body with upper and lower shadows can show reduced directional clarity.
A candle-color change can also indicate that the smoothed direction is changing.
Neither condition independently proves that a full market reversal has started.
Heikin-Ashi for Swing and Day Trading
Swing traders can use Heikin-Ashi to maintain a clearer view of multi-bar directional moves.
Day traders can use the same framework on intraday intervals, while spreads, execution costs, and the delay introduced by smoothing become proportionally more important.
Heikin-Ashi Candle Patterns to Watch For
Sustained Bullish Sequence
Consecutive bullish candles with little or no lower shadow can indicate persistent smoothed bullish movement.
Sustained Bearish Sequence
Consecutive bearish candles with little or no upper shadow can indicate persistent smoothed bearish movement.
Indecision Structure
Small bodies with shadows on both sides can signal reduced directional strength in the Heikin-Ashi calculation.
This can precede continuation, consolidation, or reversal.
Combining Heikin-Ashi with Other Technical Indicators
MACD
MACD can provide additional price-based momentum information.
A MACD crossover should not be described as confirming that a Heikin-Ashi trend must continue.
RSI or Stochastic
Oscillators can help describe momentum conditions while remaining capable of staying elevated or depressed during strong trends.
ATR
ATR measures recent price range and can be used in volatility-based stop or position-sizing frameworks.
ATR does not identify overbought or oversold conditions.
VWAP in Forex
VWAP requires volume data and is most straightforward in centralized markets.
Spot Forex does not have one centralized global transaction-volume feed, so any VWAP calculated from retail spot-FX data depends on the broker, venue, or volume source being used.
6. Comparing Renko and Heikin-Ashi Charts
Similarities Between Renko and Heikin-Ashi
Both methods transform conventional market data to create a visually smoother representation of price behavior.
They can help traders focus on directional structure while deemphasizing some smaller fluctuations.
Both also create synthetic price values, which is a major consideration for execution and backtesting.
Key Differences in Chart Construction and Use Cases
Renko Does Not Completely Eliminate Time
Renko does not display a new brick merely because another fixed interval has passed.
However, the underlying source timeframe can still influence historical Renko construction on platforms that do not have complete tick history.
Heikin-Ashi Does Not Remove Time
Heikin-Ashi remains a time-based chart.
The selected timeframe determines when each new bar forms, while the OHLC values are transformed through the Heikin-Ashi formulas.
When to Use Renko vs. Heikin-Ashi Charts
Renko can be useful when the strategy focuses primarily on the size and direction of price movement.
Heikin-Ashi can be useful when the strategy requires a smoothed representation of trend while preserving regular time intervals.
Neither method is universally superior.
7. Practical Tips for Using Renko and Heikin-Ashi Charts
Selecting the Right Chart Settings
Renko Brick Size
Brick size should be chosen according to the instrument, volatility, timeframe of the underlying data, and intended strategy.
Smaller does not mean more accurate, and larger does not mean more reliable.
Heikin-Ashi Timeframe
Select the timeframe according to the expected holding period and strategy.
Higher timeframes can display broader trends, while they do not automatically produce more reliable signals.
Avoiding Common Mistakes
Trading Synthetic Prices Directly
One of the most serious mistakes is assuming that a Renko or Heikin-Ashi chart price was necessarily available for execution.
Verify entries and exits against conventional market prices.
Assuming Smoothing Increases Accuracy
A cleaner chart can be easier to interpret without being statistically more predictive.
Optimizing Settings After Seeing the Outcome
Changing brick sizes or timeframes until historical trades look successful introduces hindsight bias.
Settings should be defined before the test and evaluated across a meaningful sample.
Ignoring Projection or Repainting Behavior
On some Renko platforms, incomplete projection bricks can change before they become confirmed.
The strategy should specify whether only completed bricks are valid signals.
Best Practices for Effective Chart Analysis
- Use real prices for execution: Confirm orders on a standard price chart or broker quote.
- Define settings in advance: Record brick size, calculation method, and timeframe.
- Include transaction costs: Spreads, commission, slippage, and financing can materially affect results.
- Use structural invalidation: Stops should reflect where the trade thesis fails.
- Track failed setups: Do not study only visually successful examples.
Backtesting Requires Special Handling
Both Renko and Heikin-Ashi are non-standard chart types with synthetic displayed prices.
A backtest that assumes entries and exits occur at those synthetic OHLC values can report unrealistic performance.
A stronger testing process generates the signal from the alternative chart while simulating execution from actual underlying market prices.
8. Integrating Renko and Heikin-Ashi with Your Trading Plan
Give Each Chart a Defined Role
Combining two tools is only useful when they answer different questions.
One possible framework is:
- Renko: Define broader price-movement direction.
- Heikin-Ashi: Monitor the persistence of the smoothed time-based trend.
- Standard candlestick chart: Determine actual entry, stop, and execution prices.
How to Combine Both Techniques for a Robust Strategy
A hypothetical long setup could require:
- Renko structure showing a defined upward sequence.
- Heikin-Ashi showing sustained bullish structure.
- Actual price remaining above predefined support.
- A conventional-chart entry trigger.
- Position size calculated from real-market invalidation.
Agreement between Renko and Heikin-Ashi does not automatically create a high-probability setup because both ultimately derive from the same underlying price data.
Examples of Real-World Applications
Example 1: Renko Trend With Heikin-Ashi Pullback
Assume EUR/USD shows a sustained sequence of upward Renko bricks.
On the one-hour Heikin-Ashi chart, bullish candles weaken and temporarily develop smaller bodies during a pullback.
The trader waits until actual EUR/USD price holds above a previously defined support area and Heikin-Ashi bullish structure returns.
The entry and stop are taken from the conventional EUR/USD price chart rather than from synthetic Renko or Heikin-Ashi values.
Example 2: Failed Renko Breakout
GBP/USD produces an upward Renko breakout from a recent brick range.
Heikin-Ashi candles initially remain bullish, but actual price quickly falls back beneath the original breakout structure.
The trade is closed at the predefined invalidation level.
Agreement between two alternative charts did not prevent the breakout from failing.
Example 3: Conflicting Signals
Renko shows an established bearish brick sequence while short-term Heikin-Ashi candles begin turning bullish.
This can simply represent a short-term recovery inside a broader decline.
The trading plan should define which chart controls the broader market condition and which chart controls entry timing.
Monitoring and Adjusting Your Approach
Strategy changes should be based on a meaningful set of results rather than one recent loss or winning streak.
A trading journal can track:
- Renko brick methodology.
- Brick size.
- Heikin-Ashi timeframe.
- Setup type.
- Actual entry and exit.
- Spread and commission.
- Rule adherence.
- Outcome.
Avoid Endless Parameter Adjustment
Changing settings every time market behavior changes makes it difficult to evaluate the original strategy.
Parameter adjustments should be researched separately and tested on new data before replacing the existing method.
9. Conclusion
Renko and Heikin-Ashi charts provide two distinct methods for simplifying the visual presentation of market prices. Renko forms bricks after predefined price movements, while Heikin-Ashi preserves time intervals and creates candles from averaged OHLC values.
Their main benefit is clarity rather than predictive certainty. Renko can make price-direction sequences easier to see, while Heikin-Ashi can make time-based trends appear smoother. Neither method removes losing trades, guarantees support or resistance, or establishes that a trend will continue.
The synthetic nature of both chart types is one of the most important practical limitations. Renko brick prices and Heikin-Ashi OHLC values are not necessarily executable market prices. This affects entries, stops, targets, and especially backtesting.
Renko also requires careful attention to implementation. Brick size, source data, reversal rules, and the underlying chart interval can change the resulting structure. Real-time projection bricks can also differ from completed historical bricks.
Heikin-Ashi formulas are more standardized, but the smoothing introduces delay and hides the exact standard open and close. A conventional candlestick or broker-price chart should therefore remain available whenever exact execution levels are required.
Combining Renko and Heikin-Ashi can create a structured trading framework when each has a defined purpose. Their agreement does not automatically provide independent confirmation because both are transformations of the same underlying price data.
The strongest approach is to define the chart settings, trading rules, invalidation, position sizing, and execution method in advance and evaluate the complete strategy using realistic market prices and transaction costs.
10. FAQs on Renko and Heikin-Ashi Charts
What is the main advantage of using Renko charts?
Renko charts emphasize price movements that exceed a predefined threshold, reducing the visual impact of smaller fluctuations. This can make directional price sequences easier to analyze.
Are Heikin-Ashi charts suitable for scalping?
They can be used on short timeframes, but the averaged candle values and resulting smoothing can make exact execution timing less direct. Scalpers should reference actual market prices for entries and exits rather than relying on synthetic Heikin-Ashi OHLC values.
Can I use both Renko and Heikin-Ashi charts together?
Yes. They can be given different roles within the same strategy. Their agreement should not automatically be treated as independent confirmation because both are calculated from price.
How do I choose the right brick size for Renko charts?
There is no universally correct brick size. It should be chosen according to the instrument, volatility, holding period, and strategy rules, then tested consistently across historical and out-of-sample data.
What are some common indicators to use with Heikin-Ashi charts?
Traders can combine Heikin-Ashi with tools such as moving averages, RSI, MACD, ATR, support and resistance, or market structure. Adding more indicators does not automatically increase signal accuracy.
Are Renko chart prices real market prices?
Renko brick values are synthetic and do not necessarily correspond to a market price available at a specific moment. Actual broker or conventional chart prices should be used for execution.
Are Heikin-Ashi prices real market prices?
Heikin-Ashi candles use calculated open, high, low, and close values. Their displayed OHLC should not automatically be treated as executable market prices.
Do Renko charts completely ignore time?
Renko does not require a new brick simply because a fixed amount of time passes. However, some platforms use time-based source bars to construct historical Renko data, so the selected underlying interval can affect the resulting bricks.
What causes a Renko reversal?
The exact rule depends on the implementation. In TradingView's conventional Renko construction, continuation requires one brick-size movement while a reversal requires movement equal to two brick sizes in the opposite direction.
Can Renko or Heikin-Ashi charts be backtested normally?
Direct backtesting using their synthetic displayed OHLC values can produce unrealistic fills. A more realistic approach uses the alternative chart for signal generation while modeling execution from actual underlying market prices.
Do Heikin-Ashi candles with no lower wick guarantee an uptrend?
No. They can accompany sustained bullish movement in the smoothed series, but the next candle can still change and actual market price can reverse.
Add a comment
Leave your thoughts